Overestimating Customer Lifespan
Assuming customers will remain active for an overly optimistic period is one of the most common LTV calculation errors, often inflating LTV by 50-100% or more.
Why this happens:
Wishful thinking about customer loyalty leads businesses to assume customers will buy for 5-10 years when historical data shows 2-3 years average lifespan. This creates false confidence in acquisition economics and leads to overspending on customer acquisition.
Confusing best customers with average customers means using the lifespan of your most loyal 10% (perhaps 7+ years) as the average when 50% of customers only purchase once. Your LTV calculation should reflect average behavior across all customers, not aspirational retention of your best segment.
Ignoring early-stage churn patterns happens when businesses exclude the first 90 days from analysis. Many customers never make a second purchase—if 40% churn immediately, that dramatically reduces average lifespan and LTV.
How to calculate realistic customer lifespan:
Use historical cohort data, not assumptions. Track customers acquired 2-3 years ago and measure how long they actually remained active. Median customer lifespan is often more accurate than mean, as a few ultra-loyal customers can skew averages upward.
Calculate lifespan from churn rate: Average Customer Lifespan = 1 / Churn Rate. If 25% of customers churn annually, average lifespan is 4 years (1 / 0.25). This grounds estimates in actual customer behavior rather than optimistic projections.
Segment lifespan by acquisition channel and customer type. Email subscribers might have 5-year average lifespan while bargain hunters from deal sites show 1-year lifespan. Calculate segment-specific LTV rather than using one universal number.
Update lifespan estimates as your business matures. Early-stage businesses with limited data might use conservative 2-year estimates, updating to data-driven calculations as cohorts age and actual behavior becomes clear.
Ignoring Gross Margin
Calculating LTV without considering gross margin leads to misleading conclusions about customer value and can result in unprofitable acquisition strategies that appear viable based on revenue-only LTV.
Why margin-adjusted LTV matters:
Revenue LTV of $1,000 appears substantial, but if gross margin is 30%, the actual profit contribution is only $300. This $300 profit LTV dramatically changes how much you can spend on acquisition while remaining profitable.
Different products and categories have different margins. A customer who spends $500 on high-margin items (60% margin = $300 profit) is more valuable than one who spends $800 on low-margin items (25% margin = $200 profit), despite lower revenue LTV.
Promotional dependency erodes margins. Customers acquired through heavy discounting might show strong revenue LTV but poor profit LTV if they only buy on sale. Their $600 revenue LTV at 15% effective margin (after discounts) yields just $90 profit LTV.
How to properly account for margins:
Calculate profit-based LTV: LTV = (AOV × Gross Margin %) × Purchase Frequency × Customer Lifespan. This shows true economic value rather than just top-line revenue.
Track both revenue LTV and profit LTV. Use revenue LTV for forecasting and planning; use profit LTV for acquisition budget setting and ROI analysis. Both serve different but valuable purposes.
Segment LTV by margin tier. Group products into high-margin (60%+), medium-margin (40-60%), and low-margin (below 40%) categories. Calculate LTV separately for customers in each tier to understand true value differences.
Account for margin erosion over time. If you acquire customers at full price but they migrate to promotional purchasing, their effective margin decreases with tenure. Model realistic margin assumptions for each year of the customer relationship.
Failing to Account for Customer Churn
Neglecting the rate at which customers stop purchasing (churn rate) can overstate LTV by 30-100%, creating dangerously optimistic acquisition budgets.
Why churn rate is critical:
Churn directly determines customer lifespan. Annual churn rate of 20% means 80% retention and 5-year average lifespan (1 / 0.20). If churn is actually 33%, lifespan is only 3 years (1 / 0.33), reducing LTV by 40%.
Early churn often gets ignored. Many customers churn after first purchase, never buying again. If 50% of customers are one-time buyers, this must factor into average lifespan and LTV calculations.
Churn compounds over time. Year 1 retention might be 70%, Year 2 retention of survivors is 80%, Year 3 is 85%. Compound these rates (0.70 × 0.80 × 0.85 = 0.476) to understand true long-term retention and calculate realistic lifespan.
How to properly incorporate churn:
Calculate cohort retention curves. Track what percentage of customers from each monthly cohort remain active after 3, 6, 12, 24, and 36 months. This reveals true retention patterns rather than assumptions.
Use cohort retention to estimate lifespan. If 50% of customers are active after 2 years, 25% after 4 years, and 12% after 6 years, you can model expected lifespan distribution and calculate weighted average LTV.
Segment churn by acquisition source. Customers from email campaigns might have 10% annual churn while deal site customers show 40% churn. LTV calculations must reflect these dramatic differences in retention.
Monitor leading indicators of churn. Time between purchases, customer service interactions, engagement with emails, and product return rates all predict churn. Use these signals to calculate probabilistic LTV that accounts for churn likelihood.
Not Segmenting Customers
Grouping all customers into a single LTV calculation masks significant differences in behavior and value, leading to poor acquisition and retention strategies.
Why one-size-fits-all LTV fails:
Acquisition channel creates enormous LTV variation. Email subscribers acquired through valuable content might show $800 LTV while customers from discount aggregator sites show $200 LTV. Blended $500 LTV misrepresents both segments and leads to misallocated budgets.
Product category preferences drive different economics. Customers who primarily buy high-margin hero products might have $1,000 profit LTV while commodity product customers show $150 profit LTV despite similar revenue LTV.
Geographic segments show different patterns. Urban customers might purchase more frequently with higher AOV but have higher acquisition costs. Rural customers might have lower AOV and frequency but also lower CAC. Segment economics vary dramatically.
Demographic and behavioral cohorts differ in value. Customers who engage with loyalty programs, read emails, or leave reviews typically show 2-3x higher LTV than passive customers who only purchase occasionally.
How to segment LTV effectively:
Calculate LTV by acquisition channel to understand which sources deliver highest-value customers. This enables intelligent CAC optimization—spending more on channels that deliver high-LTV customers even if CAC is higher.
Segment by product category preference. Identify customers who primarily purchase in each category and calculate category-specific LTV. This reveals which product lines drive customer value and deserve marketing focus.
Create behavioral segments based on engagement levels. Active customers (frequent email opens, repeat purchases, reviews) versus passive customers (infrequent, price-sensitive) show dramatically different LTV and warrant different retention investments.
Build predictive LTV models. Use early indicators (first purchase product, initial AOV, time to second purchase, channel source) to predict ultimate LTV. This enables targeting high-predicted-LTV customers earlier in their lifecycle.
Confusing Historical LTV with Future LTV
Using historical LTV as a guarantee of future performance ignores changing market conditions, competitive dynamics, and business evolution.
Why historical LTV can mislead:
Market maturation reduces LTV over time. Early customers in emerging categories often show higher LTV due to limited competition and strong brand loyalty. As markets mature and competition intensifies, LTV typically compresses by 20-40%.
Product mix shifts change average LTV. If you've expanded from high-margin hero products into lower-margin commodity items, new customer LTV will differ from historical cohorts despite using the same calculation methodology.
Customer acquisition quality evolves. Early customers acquired through content and word-of-mouth often show higher LTV than later customers acquired through paid advertising at scale. This natural quality degradation must inform LTV projections.
Retention programs and product improvements can increase LTV. If you've implemented loyalty programs, improved product quality, or enhanced customer service, future customer LTV may exceed historical performance.
How to use LTV predictively:
Track LTV by cohort and monitor trends. Compare customers acquired in each quarter over multiple years to identify improving or degrading LTV trends. Use recent cohort performance to forecast future customer value.
Build scenario models with conservative, baseline, and optimistic LTV assumptions. Understand how business performance changes under different LTV scenarios to avoid over-reliance on single-point estimates.
Adjust historical LTV for known changes. If implementing new retention programs or facing increased competition, model how these factors should impact future LTV relative to historical performance.
Putting It Into Practice
Accurate LTV calculation requires grounding estimates in actual customer behavior data, properly accounting for margins and churn, segmenting by meaningful dimensions, and recognizing that historical performance doesn't guarantee future results. Avoid the common pitfalls of optimism bias, oversimplification, and treating all customers as identical. Build comprehensive tracking systems that reveal true customer value patterns across segments and time.
Evaluate Product Profitability
ROI enables assessment of true product-line profitability by considering all associated costs, not just top-line revenue. This reveals which products deserve marketing investment and which destroy value despite appearing successful.
Calculate product-level ROI:
Build fully loaded product ROI that includes product costs, shipping costs (vary significantly by size/weight), return rates and processing costs (apparel often sees 20-30% returns), marketing spend allocated to that product, payment processing fees, and customer service costs (complex products require more support).
Identify high-margin heroes that justify aggressive marketing spend. Products with 60%+ margins can support high acquisition costs and still deliver 200-300% ROI. These deserve disproportionate ad budget even if volume is lower than bestsellers.
Recognize low-margin traps where sales volume masks unprofitability. Bestselling products with 15% margins might generate huge revenue but 0% ROI after marketing costs. Either improve margins through pricing/sourcing or accept them as loss leaders only if they drive profitable cross-sells.
Strategic product marketing decisions:
Focus ad spend on products where marketing ROI exceeds company hurdle rate. If your target ROI is 200%, don't advertise products that can't achieve it regardless of optimization quality.
Use product ROI analysis to inform pricing strategy. If a product shows 50% ROI at current pricing but margin analysis suggests a 20% price increase would only reduce volume 10%, the ROI would jump to 150%+.
Identify products that drive customer acquisition but show poor immediate ROI. A product with 0% initial ROI might be justified if acquired customers frequently repurchase high-margin items. Track cohort behavior, not just immediate metrics.
Optimize product mix in advertising creative. Feature high-ROI products prominently in ads while using low-ROI products for retargeting or customer retention where lower costs make them viable.
Assess Multi-Channel Marketing Strategies
ROI provides comprehensive evaluation of marketing channels beyond just paid advertising, revealing the true net profitability contribution of each effort.
Multi-channel ROI framework:
Include owned and earned channels, not just paid. Email marketing, organic search, content marketing, and social media all require investment (salaries, tools, time) but often show exceptional ROI due to zero marginal cost per conversion.
Calculate fully loaded channel costs. SEO costs include content creation, technical optimization, link building, and team time. Email costs include platform fees, design, copywriting, and automation development. Content marketing includes production, distribution, and promotion costs.
Measure both direct and assisted contribution. A channel with poor last-click ROI might excel at assisting conversions that other channels close. Multi-touch attribution reveals true channel value beyond last-click models.
Channel-specific optimization:
Email marketing typically delivers the highest ROI (500-1000%+) due to near-zero marginal costs. Optimize by improving segmentation, personalization, and automation. Every improvement compounds because the cost base is minimal.
Organic search shows poor ROI months 1-6 (0-50%) as you invest in content and links, then exceptional ROI months 6+ (300-500%+) as rankings drive traffic at zero per-click cost. Evaluate on 12+ month horizon.
Content marketing builds over time as evergreen content attracts compounding traffic. Initial ROI might be 25-75% but reaches 300-500%+ as content library scales and continues performing without ongoing investment.
Paid advertising shows immediate ROI but plateaus as you saturate best audiences. Continuously optimize targeting, creative, and landing pages to maintain ROI as you scale. Accept that ROI naturally compresses when scaling paid channels.
Social media organic shows highly variable ROI depending on platform and strategy. Community building might show 0% ROI year one but 400%+ year three as engaged audience drives referrals and reduces acquisition costs.
Optimize Budget Allocation
Maximize total profit dollars by reallocating resources toward highest-ROI activities while maintaining presence in strategic channels that support long-term goals.
Budget allocation framework:
Identify ROI by channel, campaign, product, and customer segment. Rank all activities by ROI performance within comparable categories (paid vs. paid, owned vs. owned, acquisition vs. retention).
Shift budget from low-ROI to high-ROI activities within each category. If email delivers 600% ROI and paid social delivers 150% ROI, increase email budget while reducing paid social—but don't eliminate paid social entirely as it serves different strategic purposes.
Test incrementally before making wholesale budget shifts. Doubling budget on a 400% ROI channel might reduce its efficiency to 250% due to audience saturation—still excellent, but not as impactful as expected.
Advanced allocation strategies:
Use marginal ROI, not average ROI, for scaling decisions. A channel showing 300% average ROI might only deliver 150% ROI on the next dollar invested due to diminishing returns. Allocate budget where marginal ROI is highest.
Maintain minimum viable presence across strategic channels even if current ROI is lower than alternatives. Total dependence on one channel creates risk. Invest 10-20% of budget in developing future high-ROI channels that are currently nascent.
Balance immediate ROI with long-term strategic value. A channel showing 100% ROI might be building brand equity that improves all other channels' performance. Some budget should support long-term positioning, not just maximize immediate ROI.
Establish hurdle rates by activity type. Acquisition campaigns might require 150% ROI; retention campaigns 300%+ ROI; brand building 50% immediate with 250% long-term. Allocate budget to activities exceeding their respective hurdles.
Improve Operational Efficiency
ROI improvements don't always require marketing optimization—operational efficiency directly impacts profitability and therefore ROI.
Operations-driven ROI improvement:
Reduce cost of goods sold through better sourcing, manufacturing efficiency, or supplier negotiations. A 10% COGS reduction might improve marketing ROI by 40-50% without any marketing changes.
Optimize shipping and fulfillment costs through better carrier negotiations, warehouse efficiency, or packaging optimization. Reducing fulfillment costs by $2 per order on $50 AOV improves margins by 4%, potentially increasing ROI by 15-20%.
Minimize return rates through better product descriptions, sizing guides, customer education, and quality control. Every percentage point reduction in return rate flows directly to improved ROI.
Improve payment processing terms and reduce fraud. Lower processing fees or fraud rates directly increase net profit and ROI without requiring marketing optimization.
ROI multiplier from operational improvements:
Calculate the ROI multiplier from operational efficiency. If current net margin is 25% and you improve it to 30% through operational improvements, marketing ROI increases by 20% (30/25 = 1.20) with zero marketing changes.
Focus on high-volume products first. Operational improvements on bestsellers deliver more total profit impact than optimizing low-volume items, even if percentage improvements are similar.
Use ROI sensitivity analysis to prioritize operational improvements. If a 5% COGS reduction improves ROI by 25% while a 5% conversion rate improvement only improves ROI by 10%, prioritize the COGS project.
Cross-Functional Alignment
ROI serves as a common language between marketing, finance, operations, and executive leadership, enabling better business-wide decision making.
ROI as communication tool:
Report marketing performance in ROI terms to finance and executive teams. While marketers think in ROAS, CPA, and conversion rates, CFOs and CEOs evaluate all investments in ROI terms. Speaking their language improves marketing credibility.
Use ROI to justify marketing budget requests. "We need 30% more budget to scale a channel delivering 300% ROI" is far more compelling than "We want to spend more on Facebook ads."
Demonstrate how non-marketing factors impact marketing ROI. When product margins change, supplier costs increase, or operational efficiency improves, ROI shifts independently of marketing performance. Tracking these relationships prevents unfair marketing evaluation.
Cross-functional optimization:
Collaborate with product team on margin improvements. Marketing can identify which products deserve R&D focus based on market demand; product team can improve margins on high-demand items to make marketing investment viable.
Work with operations to reduce fulfillment costs on high-volume products. Every dollar saved in fulfillment improves marketing ROI and may enable profitable marketing of products that were previously uneconomical to advertise.
Partner with finance to model ROI scenarios for different strategic options. Evaluate new market entry, product line expansion, or brand repositioning through ROI lens to prioritize initiatives.
Engage with customer service to reduce support costs on complex products. Lower support requirements improve product-level ROI and make previously marginal products worth promoting.
Continuous Improvement Framework
Sustainable ROI improvement requires ongoing optimization across all business functions, not one-time fixes.
Systematic improvement approach:
Establish baseline ROI by channel, product, and customer segment. You can't improve what you don't measure consistently.
Set improvement targets based on realistic assessment of opportunity. Improving ROI from 150% to 200% might be achievable through optimization; expecting improvement from 400% to 600% is likely unrealistic without fundamental business model changes.
Test systematically across all ROI drivers: targeting and audience refinement, creative and messaging optimization, conversion rate improvements, pricing and margin optimization, cost reduction initiatives, and retention and LTV improvements.
Document learnings and scale winners. Once you identify an optimization that improves ROI, implement broadly and move to the next opportunity. Compound small improvements over time.
Long-term strategic considerations:
Recognize that optimal ROI changes as markets mature. Early-stage market entry might target 300% ROI; mature market optimization might aim for 200% ROI at 3x the scale. Maximum total profit matters more than maximum ROI percentage.
Invest in capabilities that improve ROI long-term. Better analytics, attribution modeling, testing infrastructure, and team skills all require upfront investment but deliver compounding ROI improvements over years.
Balance efficiency optimization with growth investment. Don't sacrifice 20% revenue growth to improve ROI by 15%. Grow profit dollars, not just ROI percentages.
Putting It Into Practice
ROI optimization requires holistic business perspective extending beyond marketing tactics. Evaluate product profitability to focus resources on high-ROI items, assess all marketing channels comprehensively, optimize budget allocation based on marginal returns, improve operational efficiency to enhance margins, use ROI as cross-functional communication tool, and commit to continuous improvement. The businesses that excel at ROI recognize it's a whole-company metric requiring collaboration across all functions, not just marketing excellence.
Comprehensive Cost Tracking
Accurate ROI requires capturing all costs associated with generating revenue. Incomplete cost tracking is the single biggest source of ROI calculation errors.
Build a complete cost tracking system:
Create a comprehensive cost tracking template that captures all expense categories: direct ad spend (search, social, display, video, affiliates), creative production (design, copywriting, photography, video production), marketing tools and software (email platforms, analytics, CRM, ad management, SEO tools), team costs (salaries, benefits, contractors, agency fees), and operational costs (product costs, fulfillment, shipping, returns processing, payment fees).
Review and update monthly to ensure you're not missing newly added costs like additional software subscriptions, contractor hires, or increased agency fees. Costs evolve as businesses grow—your tracking system should evolve with them.
Distinguish between fixed and variable costs. Some costs (team salaries, software) remain constant regardless of campaign scale; others (ad spend, product costs) vary with volume. This distinction helps with scenario planning and scaling decisions.
Allocate shared costs proportionally. If marketing represents 20% of company activity, allocate 20% of shared overhead (office space, utilities, administrative staff) to marketing ROI calculations. While this feels imprecise, it's more accurate than excluding these costs entirely.
Ensure consistency across time periods:
Use the same cost categories and allocation methods across all time periods being compared. Changing methodologies mid-stream makes trend analysis impossible.
Document your calculation methodology clearly. When sharing ROI data with stakeholders, specify exactly what's included in costs so everyone interprets the numbers consistently.
Build cost escalation assumptions for scaling scenarios. When modeling doubled ad spend, realistic all-in costs might increase by 120-150% due to additional team needs, better tools, or more expensive creative. Model complete cost structures at different scale levels.
Effective Segmentation
ROI segmentation reveals where performance is strong versus weak, enabling targeted optimization rather than broad-brush changes.
Essential segmentation dimensions:
Segment by channel to understand which marketing activities deliver the best returns. Email, organic search, paid search, social, display, and affiliates each have different cost structures and ROI profiles. Channel-specific analysis enables intelligent budget allocation.
Segment by campaign type to distinguish brand building from performance marketing. Awareness campaigns, consideration campaigns, and conversion campaigns serve different purposes and warrant different ROI expectations. Evaluate each against appropriate benchmarks.
Segment by product or category to identify which items justify marketing investment. High-margin hero products can support aggressive marketing while maintaining strong ROI. Low-margin items may be unprofitable to advertise regardless of optimization.
Segment by customer type to understand acquisition versus retention economics. New customer acquisition typically shows lower immediate ROI that grows over time, while retention marketing shows immediate high ROI. Both are valuable but require different evaluation frameworks.
Segment by traffic source to assess quality differences. Email traffic, branded search, organic search, social, and display each arrive with different intent levels and conversion rates. Source-specific ROI reveals which audiences deliver the best returns.
How to segment effectively:
Track ROI at multiple levels—total company, channel, campaign, product, customer segment. Each level reveals different optimization opportunities. Avoid the trap of only looking at one level.
Compare segment performance within appropriate context. Email ROI should be compared to other owned channels; paid social ROI compared to other paid acquisition channels. Cross-context comparisons can be misleading as channels serve different strategic purposes.
Set segment-specific ROI targets based on strategic role. Acquisition campaigns might target 150% ROI; retention campaigns 400%+ ROI; brand awareness 75% immediate, 300% long-term. Different activities warrant different thresholds.
Analyze segment trends over time, not just absolute performance. A channel declining from 300% to 200% ROI deserves attention even if absolute performance remains acceptable. Early trend detection enables proactive optimization.
Time Horizon Considerations
ROI varies dramatically based on measurement timeframe. Properly accounting for time horizons prevents undervaluing long-term strategies while overvaluing short-term tactics.
Establish multiple ROI timeframes:
Calculate immediate ROI (30-90 days) for quick assessment of campaign viability. This shows whether tactics generate positive returns in the short term and can sustain themselves.
Calculate long-term ROI (12+ months) for strategic investments. SEO, content marketing, email list building, and brand awareness often show poor immediate ROI but exceptional long-term returns as investments compound.
Track cohort-based ROI over extended periods. Customers acquired in January have reliable 12-month data by December. Use this historical cohort data to set realistic long-term ROI expectations for current acquisition efforts.
Monitor ROI velocity—how quickly investments pay back. Two campaigns with identical 12-month ROI but different payback periods (3 months vs. 9 months) have different value due to cash flow and reinvestment opportunities.
Use timeframes appropriately:
Use immediate ROI for tactical optimization of proven channels. If a Facebook campaign shows poor 30-day ROI, optimize targeting, creative, and landing pages or pause the campaign.
Use long-term ROI for strategic budget allocation decisions. Allocate significant budget to channels showing strong 12-month ROI even if immediate performance appears weak, as long as you have cash flow to support the timeline.
Separate growth investments from optimization efforts in ROI tracking. Brand building, market expansion, and new channel testing should have different ROI thresholds and timeframes than proven performance marketing in established channels.
Build patience into your investment framework. Allow at least 90-180 days for new channels or strategies to mature before judging ROI performance, unless early signals clearly indicate fundamental problems.
Baseline Establishment and Benchmarking
Accurate ROI assessment requires understanding what "good" looks like for your specific business, not just industry averages.
Establish meaningful baselines:
Create historical baselines by channel, campaign type, and time period. Know that email historically delivers 500% ROI, paid search 250% ROI, and display 100% ROI. Current performance should be evaluated against your historical norms, not generic industry benchmarks.
Account for seasonality in baselines. Holiday periods typically show 150-200% of baseline ROI; post-holiday periods drop to 60-80%. Compare current performance to equivalent historical periods, not sequential months.
Segment baselines by customer type and traffic source. New customer acquisition from cold traffic may baseline at 150% ROI while retention marketing to engaged customers baselines at 400%+ ROI. Set expectations appropriately.
Benchmark intelligently:
Use industry benchmarks as directional guidance, not absolute targets. Your business model, margin structure, and competitive position may justify different ROI targets than industry averages suggest.
Focus on beating your own historical performance rather than competitors' reported numbers. Competitive ROI figures often use different calculation methodologies or exclude costs that you include, making direct comparisons misleading.
Recognize that ROI benchmarks evolve as markets mature. Early-stage markets may support 400-500% ROI that compresses to 200-300% as competition intensifies. Expecting constant ROI improvement ignores market dynamics.
External Factor Adjustment
Proper ROI analysis requires accounting for external influences that impact performance independently of campaign quality.
Track and adjust for external factors:
Monitor seasonal patterns and build seasonal adjustment factors. If Q4 historically shows 180% of baseline ROI, current Q4 performance of 200% baseline represents only 11% actual improvement (200/180 = 1.11), not 100% improvement.
Track economic indicators relevant to your business. Consumer confidence, unemployment, interest rates, and GDP growth all influence purchase behavior. When macro conditions shift, adjust ROI expectations accordingly.
Monitor competitive activity through price tracking, promotional monitoring, and market share analysis. If ROI drops when competitors run aggressive promotions, the issue isn't your campaigns—it's competitive intensity.
Stay current on platform changes. Algorithm updates, policy changes, and feature rollouts can dramatically impact ROI overnight. Document when major platform changes occur so you can attribute ROI shifts appropriately.
Isolate campaign impact from environmental factors:
Use control groups and holdout testing to separate campaign effects from external factors. Comparing test regions to control regions reveals whether ROI changes reflect your actions or broader market shifts.
Document external context when ROI changes significantly. "Q4 ROI increased 40%" is incomplete analysis; "Q4 ROI increased 40% driven by 25% seasonal lift plus 15% from campaign optimization" provides actionable insight.
Build regression models that account for multiple variables simultaneously. Understand how seasonality, economic conditions, competitive activity, and campaign changes each contribute to ROI movements.
Establishing Causation
Correlation doesn't prove causation. Proper ROI analysis requires confirming that observed changes result from the factors you believe caused them.
Test for true causation:
Use controlled A/B testing whenever possible. Roll changes to 50% of traffic and compare to control group. If ROI improves in test group but not control, you've established causal relationship.
Look for mechanism, not just correlation. If you can explain why a change should improve ROI and the data supports it, causation is more likely than if results appear without logical explanation.
Check for alternative explanations before concluding causation. When ROI improves after campaign changes, verify that seasonality, competitive activity, site performance, and other factors haven't also shifted.
Allow sufficient time for statistical significance. Week-to-week ROI fluctuations often reflect noise rather than real changes. Test over 2-4 week periods minimum to ensure results are meaningful.
Putting It Into Practice
ROI analysis excellence requires comprehensive cost tracking, meaningful segmentation, appropriate time horizons, accurate baselines, external factor adjustment, and causal validation. Build systematic processes for each element rather than relying on ad hoc analysis. The businesses that excel at ROI analysis invest in proper infrastructure and discipline—the insights generated more than justify the effort.
Not Including All Costs
Underestimating costs by only considering direct ad spend is the most common ROI calculation error, typically overstating true ROI by 50-200%. Incomplete cost accounting leads to false confidence in campaign profitability and misguided investment decisions.
Costs commonly excluded but essential for accurate ROI:
Marketing costs beyond ad spend include creative production costs (design, copywriting, photography, video), marketing software and tools (email platforms, analytics, CRM, ad management), agency fees and contractor costs, marketing team salaries and benefits, and promotional discounts or coupons used for acquisition.
Product and fulfillment costs include cost of goods sold (manufacturing or wholesale costs), packaging and shipping materials, shipping carrier costs, warehouse and fulfillment labor, payment processing fees (2-3% of transaction value), and returns processing and restocking.
Overhead allocation means a proportional share of office space, utilities, customer service costs, and administrative overhead should be allocated to campaigns. If marketing represents 20% of company activity, allocate 20% of overhead costs.
Without comprehensive cost tracking, a campaign appearing to deliver 300% ROI might actually generate only 100% ROI when all costs are included—still profitable, but far less attractive than believed.
Ignoring Long-Term Value
Focusing solely on short-term gains misses the bigger picture and systematically undervalues strategies with compounding returns. Some investments show poor immediate ROI but deliver substantial long-term benefits that justify ongoing commitment.
Why this pitfall is dangerous:
SEO and content marketing often show 0-50% ROI in months 1-3 as you invest in content creation and link building without immediate ranking improvements. By months 6-12, as content ranks and attracts organic traffic, ROI often reaches 300-500%+ with minimal ongoing spend. Evaluating only immediate returns would kill these high-value strategies.
Email list building requires upfront investment in lead magnets, automation setup, and list growth tactics that show limited immediate ROI. However, owned email audiences generate recurring revenue at near-zero marginal cost for years, delivering cumulative ROI of 1000%+ over a subscriber's lifetime.
Brand awareness campaigns create lasting mental availability that reduces future acquisition costs and improves conversion rates across all channels. Immediate ROI might be 50-100%, but the compounding effect of brand equity delivers multiples of that over time.
Short-term ROI obsession leads to chronic underinvestment in growth drivers and overinvestment in quick wins that don't build lasting value.
Not Segmenting by Channel or Campaign
Grouping ROI across all marketing activities masks underperforming areas and obscures optimization opportunities. Blended ROI of 200% could hide one channel at 400% carrying another at 50%.
Why blended metrics mislead:
Channel-blinded optimization means without knowing email delivers 500% ROI while display shows 75% ROI, you might cut overall marketing budget when you should shift from display to email. Aggregated data hides actionable insights.
Product-level blindness means high-margin hero products might show 400% ROI while low-margin commodity items achieve 50% ROI. Without segmentation, you can't focus ad spend where it drives profitability.
Customer segment confusion happens when new customer acquisition shows 150% immediate ROI that grows to 400% lifetime ROI, while repeat customer marketing shows 500% immediate ROI. Blended metrics obscure which strategies deserve investment.
Campaign-type mixing occurs when branding campaigns show 100% ROI while conversion-focused campaigns hit 300% ROI. Both are valuable but serve different purposes and warrant different investment levels. Aggregation prevents proper evaluation.
Failing to Adjust for External Factors
External influences like economic conditions, seasonality, competitive activity, and consumer behavior shifts impact ROI independently of campaign quality. Misattributing externally driven ROI changes to campaign performance leads to wrong optimization decisions.
External factors that distort ROI:
Seasonality creates predictable ROI patterns. Holiday periods typically show 150-200% of baseline ROI due to elevated purchase intent and conversion rates, while post-holiday periods drop to 60-80% of baseline. Crediting improved Q4 ROI to campaign optimization when it's actually seasonal lift leads to overinvestment in tactics that won't work year-round.
Economic conditions affect consumer spending and competitive intensity. Recessions reduce discretionary spending, compressing ROI across all campaigns. Economic booms increase consumer confidence, inflating ROI. Blaming marketing for macro-driven ROI changes is counterproductive.
Competitive pricing and promotional activity shifts customer behavior. Aggressive competitor sales may temporarily depress your ROI as customers comparison shop, even if your campaigns haven't changed. Without monitoring competitive activity, you might "optimize" campaigns that aren't actually the problem.
Platform algorithm or policy changes alter campaign performance overnight. iOS privacy updates, Google algorithm changes, or platform policy shifts can dramatically impact ROI independently of campaign quality. Failing to track platform changes leads to misdiagnosis.
Supply chain or inventory issues impact conversion and profitability. Out-of-stock hero products or delayed shipping times reduce conversion rates and increase returns, depressing ROI through mechanisms unrelated to marketing effectiveness.
Confusing Correlation with Causation
When ROI improves, the natural tendency is to credit recent campaign changes. However, multiple factors influence ROI simultaneously, and timing coincidence doesn't prove causal relationship.
Why false attribution is dangerous:
New campaigns launching during seasonal upswings appear highly effective when they're simply riding seasonal trends. Crediting the campaign leads to overinvestment in tactics that don't actually drive the results.
Halo effects from brand campaigns improve performance across all channels. Attributing conversion campaign ROI improvement to tactical optimization misses that brand awareness did the heavy lifting. You might then cut brand spend thinking it's unnecessary.
Competitive dynamics shift continuously. Your ROI might improve because competitors paused their aggressive promotions, not because your campaigns optimized. False confidence in campaign changes leads to doubling down on tactics that won't work when competitive environment shifts back.
Random variation gets mistaken for meaningful improvement. ROI fluctuates naturally—a week of 250% ROI following weeks of 200% might be noise, not signal. Reacting to noise wastes resources on changes that don't matter.
Comparing Incomparable Metrics
Treating all ROI numbers as equivalent regardless of how they're calculated creates confusion and poor decision-making.
Common comparison errors:
Marketing ROI vs. true ROI confusion happens when one team calculates ROI using only marketing costs while another includes all business costs. The numbers appear comparable but measure completely different things. Always clarify calculation methodology.
Immediate vs. lifetime ROI mixing occurs when comparing new customer acquisition (150% immediate, 400% lifetime) against retention campaigns (500% immediate). Without specifying time horizon, the comparison is meaningless.
Gross vs. net profit inconsistency means if one analysis uses gross profit (revenue minus product costs) while another uses net profit (revenue minus all costs), ROI calculations are incompatible. Standardize profit definitions.
Attribution model mismatches happen when comparing last-click ROI from one channel against multi-touch ROI from another. Different attribution methodologies produce different ROI numbers that shouldn't be directly compared.
Putting It Into Practice
Avoiding these pitfalls requires discipline and systematic thinking. Include all costs, account for appropriate time horizons, segment meaningfully, adjust for external factors, establish causation rather than assuming it, and ensure consistent calculation methodologies. Most ROI mistakes stem from taking shortcuts or accepting surface-level analysis—invest the effort to do it properly.
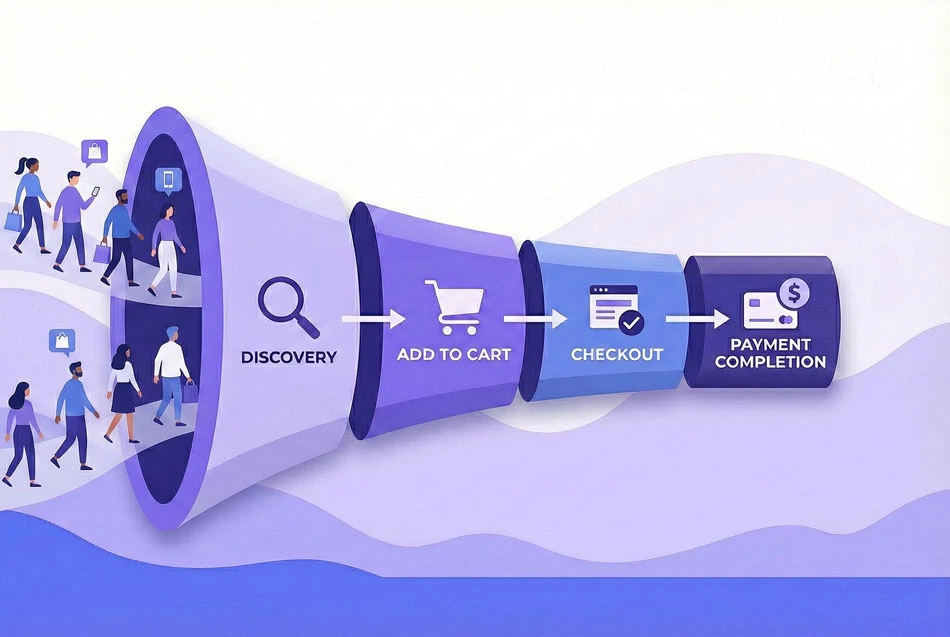
Simplify the Checkout Process
Every additional step or field in checkout creates an opportunity for abandonment. Complexity is the enemy of completion.
Reduce checkout steps:
Minimize the number of pages or screens required to complete purchase. Multi-step checkouts (contact → shipping → payment → review) create 5-10 percentage points more abandonment than single-page checkouts for most product categories. Each transition point is a decision point where customers can leave.
Implement single-page checkout where feasible. Display all required information on one scrolling page with logical visual grouping: customer info at top, shipping in middle, payment at bottom. This eliminates page load delays and provides clear progress visibility.
Combine related information requests. Billing and shipping address can share one form section with a checkbox for "same as shipping." Contact info and account creation can merge into one step. Every consolidation reduces friction.
Auto-fill for returning customers:
Pre-populate all saved information for logged-in customers. Returning customers should only need to confirm their details and complete payment—not re-enter everything. This reduces checkout time by 80% and completion rates often exceed 90%.
Use browser auto-fill and payment request APIs to enable one-click completion. Chrome's payment request API, Apple Pay, and Google Pay leverage stored information for instant checkout, even for first-time customers on your site.
Implement smart address validation and auto-complete. As users type addresses, suggest completions from postal databases. This speeds entry and reduces shipping errors that could cause post-purchase problems.
Offer Guest Checkout
Forcing account creation before purchase is one of the most damaging checkout practices, typically reducing CCR by 20-30 percentage points.
Why guest checkout matters:
Account creation adds 3-5 form fields (username, password, confirm password) and creates psychological barrier. Customers in buying mode want to complete purchase, not commit to a relationship with your brand. Account creation shifts focus from transaction to relationship decision-making.
Many customers specifically resist account creation due to privacy concerns, password fatigue, or expectation they're one-time buyers. Forcing the issue loses immediate sales and creates negative brand associations that prevent future purchases.
First-purchase customers haven't yet experienced your value. After a successful transaction and positive product experience, many voluntarily create accounts for convenience. Requiring it before they've experienced value puts the cart before the horse.
How to implement guest checkout effectively:
Make guest checkout the prominent option, not a hidden alternative. Primary call-to-action should be "Continue as Guest" with secondary option to "Log In" for returning customers. Defaulting to account creation makes guest checkout feel like a workaround.
Collect minimal information for guest checkout: email, shipping address, payment details only. Save upsells, newsletter signups, and account creation offers for post-purchase when customer satisfaction is high.
After successful guest checkout, offer optional account creation with the appeal of "save your info for faster future checkout." Post-purchase conversion to accounts runs 30-40% versus 5-10% for pre-purchase forced creation.
Optimize for Mobile Devices
Mobile checkout completion rates lag desktop by 10-20 percentage points primarily due to friction, not intent differences. Mobile-specific optimization is critical.
Responsive design fundamentals:
Ensure checkout displays properly on all screen sizes with readable text (minimum 16px font) and properly sized touch targets (minimum 44×44px buttons). Customers shouldn't need to zoom or struggle to tap buttons.
Use single-column layouts on mobile. Side-by-side forms that work on desktop become cramped and error-prone on mobile. Stack everything vertically with generous spacing.
Minimize typing requirements through smart input types (tel, email, number) that trigger appropriate keyboards, and use native mobile elements like date pickers and dropdowns instead of text entry where possible.
Streamlined mobile payment:
Integrate mobile wallets prominently. Apple Pay and Google Pay enable one-tap checkout using stored payment information, often improving mobile CCR by 15-25 percentage points. Make these options primary choices, not buried alternatives.
Optimize credit card entry for mobile. Use card scanning where supported, format card numbers automatically with proper spacing, auto-advance between fields, and ensure CVV/expiry fields are easily tappable.
Reduce form fields to absolute minimum on mobile. Combine first/last name into single field, use address auto-complete aggressively, and save optional fields for post-purchase profile creation.
Mobile-specific UX considerations:
Implement progress indicators so users understand how many steps remain. Mobile users get impatient when they can't see the end.
Use sticky "Continue" or "Place Order" buttons visible without scrolling. Mobile users shouldn't need to scroll to find the next action.
Minimize external links during checkout. Every link risks losing the customer to distraction. Open necessary links (terms, privacy policy) in modal overlays, not new tabs.
Display Trust Signals
Cart abandonment often stems from security concerns or purchase hesitation at the final moment. Trust signals reduce anxiety and improve completion.
Security and payment trust:
Display SSL certificates and secure payment icons (padlock symbol, "Secure Checkout" badges) prominently near payment entry. Customers need reassurance their payment information is protected.
Show accepted payment methods clearly before payment entry. Customers abandon if they don't see their preferred payment option. Display all accepted methods upfront to set proper expectations.
Include payment processor logos (Stripe, PayPal, Visa, Mastercard) to leverage their trusted brands. Third-party security validation carries more weight than self-certification.
Social proof and credibility:
Include customer testimonials or ratings near the checkout button. Brief quotes from satisfied customers provide reassurance at the moment of decision: "Fast checkout, received in 2 days" carries weight.
Display recent purchase notifications ("15 people bought this today") to create urgency and social validation. However, ensure these are genuine—fake scarcity destroys trust.
Show customer service contact information clearly. Live chat availability during checkout reduces abandonment by 10-15% as customers can ask questions without leaving.
Policy transparency:
Provide clear links to privacy, return, and shipping policies. These should open in modal overlays during checkout, not redirect customers away. Customers need policy access without abandoning their cart.
Display satisfaction guarantees or money-back policies near the purchase button. "30-day returns, no questions asked" removes purchase risk.
Show estimated delivery dates before checkout completion. Uncertainty about when products arrive drives abandonment. "Arrives by Tuesday, Jan 14" provides concrete expectation.
Eliminate Unexpected Costs
Unexpected costs revealed at checkout cause 60% of cart abandonment. Cost transparency throughout the journey is critical.
Display costs early:
Show shipping estimates on product pages or in cart before checkout. Customers shouldn't discover shipping costs for the first time at payment entry. Early disclosure prevents sticker shock abandonment.
Offer free shipping thresholds and communicate them clearly. "Add $15 more for free shipping" encourages larger orders and eliminates shipping as abandonment cause.
Include all taxes and fees in displayed pricing where legally possible. The total price should match customer expectations, not surprise them.
Simplify cost structure:
Consider building shipping into product pricing to advertise "free shipping." Customers overwhelmingly prefer $50 + free shipping over $45 + $5 shipping even though total is identical.
Minimize fees and surcharges. Every additional line item (processing fee, convenience fee, handling fee) increases abandonment. Consolidate costs into base price or shipping.
Be transparent about any unavoidable additional costs early in the checkout process, not at the final confirmation screen.
Set Up Performance Monitoring
Proactive monitoring enables quick response to CCR changes, especially when making checkout modifications or introducing new features.
Implement alerting:
Configure alerts for significant CCR drops (e.g., 10+ percentage point decline day-over-day or week-over-week). Immediate notification enables rapid investigation and rollback if needed.
Monitor CCR by segment (device, traffic source, customer type) not just overall. Mobile CCR might crash while desktop remains stable, which blended metrics would mask.
Track step-level completion rates for each checkout stage. Alert on specific step degradation to pinpoint problems quickly.
Testing and validation:
A/B test all checkout changes before full rollout. Deploy modifications to 50% of traffic and measure impact before committing. CCR changes can represent hundreds of thousands in revenue—validate before scaling.
Monitor for at least one week before concluding test results. Day-to-day variation is normal; weekly trends are meaningful. Ensure statistical significance before making decisions.
Document all checkout changes with before/after CCR measurements. Historical context helps identify which modifications drove improvement and should be replicated.
Putting It Into Practice
Checkout completion rate improvement requires systematic focus on reducing friction, building trust, and eliminating surprises. Simplify your checkout flow, offer guest checkout, optimize mobile experience, display trust signals prominently, ensure cost transparency, and monitor performance actively. Small improvements compound—a 5-point CCR increase on 10,000 monthly checkout initiations recovers 500 transactions that would otherwise be lost.
Lack of Data Segmentation
Failing to segment data can lead to incorrect assumptions and misguided optimization efforts. A decline in overall CCR might prompt you to remove a new upsell offer, when the real culprit is actually a mobile-specific payment processing issue affecting only 30% of your traffic.
Why segmentation matters:
Device type segmentation reveals dramatically different performance. Desktop users might maintain 85% CCR while mobile drops to 60%, masking a mobile experience crisis when you only look at blended 75% CCR. Without segmentation, you'd optimize for average performance instead of fixing the real problem.
Traffic source segmentation shows intent quality differences. Email traffic completing at 90% CCR versus social traffic at 55% indicates different customer readiness, not checkout quality. Optimize differently for each source rather than applying one-size-fits-all changes.
New vs. returning customer segmentation identifies friction for first-time buyers. If returning customers complete at 88% but new customers only 65%, your account creation or trust signals need improvement, not your payment flow.
How to segment effectively:
Always analyze CCR by device type (desktop, mobile, tablet), browser (Chrome, Safari, Firefox), traffic source (email, paid search, organic, social), customer type (new vs. returning), and geographic region. These segments reveal where problems exist rather than just that problems exist.
Compare segment performance over time, not just absolute rates. Desktop CCR dropping from 85% to 78% is more alarming than mobile sitting stable at 65%, even though desktop still outperforms mobile in absolute terms.
Set segment-specific benchmarks and targets. Expecting 85% mobile CCR when industry standard is 65% leads to misallocated optimization efforts. Focus on being competitive within each segment rather than achieving uniform performance across all segments.
Ignoring Partial Completions and Drop-Off Points
Overlooking where customers abandon within the checkout process masks underlying issues. Knowing overall CCR is 70% tells you there's a problem but not what the problem is or how to fix it.
Why step-level analysis is critical:
Different abandonment patterns require different solutions. If 90% complete contact information but only 75% enter payment details, the issue is payment trust or complexity. If 95% enter payment but only 70% click final submit, the issue is final review stage concerns or unclear next steps.
Progressive drop-off vs. single-step crashes indicate different problems. Gradual 5% loss at each of five steps suggests general friction. A 30% drop at one specific step indicates a critical issue at that stage requiring immediate attention.
Mobile vs. desktop drop-off points often differ. Desktop users might abandon at payment entry (form complexity), while mobile users abandon earlier at address entry (typing friction). Step-level segmentation reveals device-specific optimization opportunities.
How to analyze drop-off effectively:
Map the complete checkout funnel: checkout start → contact info → shipping address → shipping method → payment info → order review → purchase complete. Calculate completion rate for each step transition.
Identify the largest drop-off transitions. If contact info → shipping address shows 95% completion but shipping address → payment info drops to 70%, concentrate optimization efforts on the shipping-to-payment transition.
Use session recordings to understand why customers abandon at specific steps. Quantitative data shows where problems occur; qualitative observation shows why. Watch actual users navigate problem areas to identify unexpected friction.
Test solutions at the specific drop-off point rather than redesigning the entire checkout. If payment entry is the problem, test different payment forms, add trust badges at that step, or simplify payment field requirements.
Assuming Uniform Behavior Across Platforms
Desktop and mobile users behave fundamentally differently in checkout. Treating them identically leads to optimizing desktop while destroying mobile experience, or vice versa.
Key platform behavior differences:
Input friction varies dramatically. Desktop users tolerate 20-field forms; mobile users abandon after 5-6 fields. Desktop benefits from detailed information displays; mobile requires progressive disclosure to avoid overwhelming screens.
Attention and distraction patterns differ. Desktop users focus intensely during checkout; mobile users frequently multitask or get interrupted. Desktop can require complex decision-making; mobile needs streamlined, low-cognitive-load flows.
Payment method preferences vary by device. Desktop users more readily enter credit card details; mobile users prefer digital wallets and one-tap payment options that minimize typing.
How to optimize per platform:
Design mobile checkout independently rather than responsive-scaling desktop checkout. Mobile-first design forces simplification that benefits both platforms; desktop-first design adds mobile friction that desktop users never experience.
Customize field requirements by device. Require full details on desktop; use smart defaults and minimal required fields on mobile. Different platforms justify different information collection strategies.
Offer platform-appropriate payment methods prominently. Feature Apple Pay and Google Pay on mobile; ensure traditional card entry is optimized on desktop. Meet users where they are rather than forcing uniform options.
Test separately on each platform. A change that improves desktop CCR by 5% might reduce mobile CCR by 10%. Always measure platform-specific impact before rolling out changes across all devices.
Attributing All CCR Changes to Recent Modifications
When CCR changes, the natural tendency is to blame the most recent modification. However, CCR responds to many factors beyond your direct control.
External factors affecting CCR:
Seasonal and promotional timing impacts intent quality. Black Friday traffic completes at higher rates due to strong purchase intent; January browsing traffic abandons more frequently. Compare year-over-year for the same period rather than sequential months.
Payment processor issues or downtime cause CCR crashes unrelated to your checkout design. Monitor processor status and distinguish technical failures from user experience problems.
Competitive pricing changes affect intent strength. If competitors run aggressive sales, customers may start your checkout, comparison shop, then abandon. Track competitive activity when diagnosing CCR shifts.
Traffic source mix changes alter blended CCR. Increased social ad spend might reduce blended CCR not because checkout worsened but because social traffic inherently converts worse. Segment by source to separate mix effects from true performance changes.
How to properly diagnose CCR changes:
Establish baseline expectations accounting for seasonality and traffic mix. Compare current performance to equivalent historical periods with similar traffic composition.
Isolate changes through controlled testing. If unsure whether a checkout modification impacts CCR, roll it out to 50% of traffic and compare to the control group. This separates correlation from causation.
Monitor external factors alongside CCR. Track payment processor uptime, competitive activity, traffic source distribution, and seasonal patterns to contextualize CCR movements.
Putting It Into Practice
Effective CCR analysis requires proper data segmentation, step-level funnel tracking, platform-specific optimization, and careful attribution of changes to actual causes. Avoid the trap of surface-level analysis that looks only at blended CCR—dig into segments, identify specific drop-off points, and understand the why behind the numbers before making optimization decisions.
Assess Overall Marketing Performance
A declining MER indicates that marketing spend is increasing faster than revenue, signaling the need to refine campaigns. However, the diagnosis matters as much as the symptom.
Performance assessment framework:
Identify whether MER decline stems from rising costs or falling revenue. Rising CPMs and CPCs across channels suggest market saturation or increased competition requiring creative refresh or audience expansion. Falling conversion rates point to website, offer, or product-market fit issues.
Segment MER analysis by time period and campaign type. Seasonal patterns are normal—holiday MER of 8 dropping to off-season MER of 4 doesn't require action if the pattern is consistent year-over-year. Compare current periods to historical baselines rather than absolute targets.
Compare your MER trends against industry benchmarks and competitive intelligence. If your MER is declining but remains above industry averages, you're still performing well. If it's declining faster than competitors', you're losing ground and need aggressive optimization.
Track MER velocity—the rate of change matters as much as the absolute number. Stable MER at 5 is healthier than volatile swings between 3 and 7, even if the average is similar.
Optimize Budget Allocation
Focus budget on high-performing campaigns while reducing spend on underperforming ones. This reallocation is the fastest path to MER improvement.
Budget optimization tactics:
Calculate channel-specific ROAS and compare to blended MER. Channels performing above blended MER deserve increased investment; channels below blended MER need optimization or budget reduction. If overall MER is 5 but email shows ROAS of 12 while display shows 2, dramatically shift budget toward email.
Test scaling high-performers before cutting low-performers. Doubling budget on a channel with ROAS of 8 might reduce its efficiency to 6—still profitable, but not as impactful as expected. Understand diminishing returns curves before making major reallocations.
Identify complementary channel effects before cutting. A channel with low direct ROAS might drive significant assisted conversions that boost other channels' performance. Cutting it could damage overall MER despite appearing inefficient in isolation.
Maintain minimum viable presence across channels to protect against platform dependency. Concentrating all budget in one high-performing channel creates vulnerability if that channel's costs spike or effectiveness drops.
Enhance Website Conversion Rate
Improving site conversion rates boosts revenue without increasing ad spend, directly improving MER. A 20% conversion rate improvement delivers the same revenue impact as 20% more traffic at zero additional cost.
Conversion optimization for MER improvement:
Focus on high-traffic, low-converting pages first. A 2% improvement on a page receiving 10,000 monthly visitors (200 extra conversions) delivers more impact than 10% improvement on a page with 500 visitors (50 extra conversions).
Test value proposition clarity and friction reduction. Visitors who don't understand your offering or face unnecessary obstacles won't convert regardless of traffic quality. Ensure messaging matches ad promises and checkout flows minimize steps.
Optimize for mobile conversion specifically. With 60%+ mobile traffic becoming standard, mobile conversion rate often determines overall MER. Desktop-optimized sites with poor mobile experience waste the majority of ad spend.
Implement personalization based on traffic source. Visitors from different channels have different intent and context—generic experiences underperform tailored landing pages that acknowledge how users arrived and what they're seeking.
Leverage Customer Retention Strategies
Existing customers convert at 3-5x the rate of new visitors at near-zero acquisition cost. Retention marketing dramatically improves blended MER.
Retention tactics for MER improvement:
Develop email marketing nurture sequences that encourage repeat purchases. Welcome series, post-purchase education, replenishment reminders, and re-engagement campaigns all drive incremental revenue without ad spend, improving overall MER.
Implement loyalty programs that incentivize repeat business. While discounts reduce margins, the revenue from repeat purchases at minimal acquisition cost improves MER significantly compared to paid acquisition of new customers.
Create VIP or subscription programs that generate predictable recurring revenue. Customers on subscription or loyalty tiers typically show 3-10x lifetime value and require minimal ongoing marketing spend.
Use post-purchase surveys to understand customer satisfaction and identify retention risks. Preventing churn is more MER-efficient than replacing churned customers through paid acquisition.
Utilize Cost-Effective Channels
Organic marketing strategies drive revenue without direct ad spend, improving blended MER by increasing the numerator without affecting the denominator.
Cost-effective channel strategies:
Invest in SEO for long-term organic traffic that converts without per-click costs. SEO requires significant upfront investment but delivers compounding returns—year-one MER might be 2, but year-three could hit 15+ as organic volume scales.
Develop content marketing that attracts and converts high-intent visitors. Educational guides, comparison tools, and valuable resources draw traffic that converts better than cold advertising while building brand authority that improves all channel performance.
Build organic social presence and community engagement. While slower than paid advertising, engaged communities generate word-of-mouth referrals and direct traffic with near-zero acquisition cost.
Optimize for branded search volume through brand-building activities. Customers searching for your brand directly show the highest conversion rates and lowest CPCs. Increasing branded search volume through PR, partnerships, and customer satisfaction dramatically improves MER.
Test and Iterate Systematically
MER improvement requires continuous testing and optimization rather than one-time fixes.
Testing framework for MER optimization:
Run controlled experiments that isolate variables. Testing multiple changes simultaneously makes it impossible to identify what actually drives improvement. Test ad creative, landing pages, offers, and audiences separately.
Set clear success metrics beyond MER. An optimization that improves MER from 4 to 5 but reduces revenue by 20% failed despite improving the target metric. Always track revenue, conversion rate, and customer quality alongside MER.
Allow sufficient time for statistical significance. Week-to-week MER fluctuations often reflect noise rather than real changes. Test over 2-4 week periods minimum to ensure results are meaningful.
Document learnings and scale winners. Once a test clearly improves MER while maintaining revenue growth, implement broadly and move to the next optimization opportunity.
Putting It Into Practice
Improving MER requires a balanced approach: assess performance to identify root causes, optimize budget allocation toward high-performers, enhance conversion rates to maximize traffic value, leverage retention for cost-effective revenue, and test systematically to drive continuous improvement. The goal is sustainable MER improvement that supports revenue growth and profitability, not efficiency gains that sacrifice business objectives.
Misalignment with Business Goals
Focusing solely on improving MER can lead to cutting marketing spend, which potentially harms long-term growth. A business reducing spend from $50,000 to $30,000 might see MER improve from 4 to 5, but if revenue drops from $200,000 to $150,000, the "improved" efficiency actually destroyed $50,000 in revenue.
How to avoid this pitfall:
Balance MER with growth objectives. Use MER alongside Customer Acquisition Cost (CAC) and Lifetime Value (LTV) to ensure sustainable growth. A healthy business might accept temporary MER decline from 5 to 4 if it enables scaling from $200,000 to $400,000 in monthly revenue.
Recognize that strategic investment in growth often means accepting lower MER temporarily. Entering new markets, testing new channels, or building brand awareness typically shows lower initial efficiency but creates long-term value that MER alone doesn't capture.
Set MER targets in context of revenue goals. Instead of "maximize MER," aim for "maintain MER above 4 while growing revenue 20% month-over-month." This frames efficiency as a constraint rather than the primary objective.
Overlooking Discounts and Promotions
Heavy reliance on discounts can inflate revenue figures, making MER appear healthy while profit margins suffer. A business with MER of 6 looks efficient, but if they're achieving that through 30% discounts that destroy margin, the actual profitability is terrible.
How to maintain accurate profitability assessment:
Monitor contribution margin alongside MER to get a true picture of profitability. Contribution margin accounts for product costs and discounts, revealing whether revenue efficiency translates to profit efficiency.
Calculate promotion-adjusted MER by treating discount amounts as additional marketing costs. If you spend $20,000 on ads and offer $8,000 in promotional discounts, your true marketing investment is $28,000, not $20,000.
Assess how discounts affect both immediate MER and long-term customer value. Acquiring discount-seeking customers at strong MER means nothing if they never return at full price. Track cohort retention and repeat purchase rates by acquisition method.
Track promotional vs. non-promotional revenue separately. Understanding your baseline MER without promotions reveals true marketing efficiency and helps avoid the trap of addiction to discounting for maintaining revenue levels.
Ignoring Attribution Complexity
MER's simplicity—total revenue divided by total spend—hides the complexity of how customers actually purchase. Multi-touch journeys, offline influences, and organic factors all contribute to revenue but don't appear in marketing spend calculations.
How to account for attribution nuance:
Recognize that MER includes revenue from all sources, not just marketing-driven sales. Organic search, direct traffic, word-of-mouth, and brand equity all contribute to the numerator without appearing in the denominator, inflating apparent marketing efficiency.
Compare MER to channel-specific ROAS to understand which activities genuinely drive efficiency. If overall MER is 6 but your paid channels show ROAS of 3, the gap reveals significant non-paid revenue contribution that might disappear if you cut marketing spend chasing higher MER.
Use incrementality testing to understand how much revenue actually depends on marketing. Periodically pause or reduce spend in test markets to measure the true impact of marketing versus baseline sales that would occur anyway.
Focusing Only on Top-Line Revenue
MER measures revenue efficiency but says nothing about profit efficiency. High MER with low margins or high operational costs can still result in unprofitable growth.
How to connect MER to actual profitability:
Calculate your breakeven MER based on gross margin. If gross margin is 40%, breakeven MER is 2.5 (1 / 0.40). Any MER below this level loses money regardless of revenue volume.
Set profit-oriented MER targets that ensure desired profitability levels. If you need 15% net profit margin and gross margin is 45%, account for 30% operational costs and target MER of 3.3+ (1 / 0.45 / 0.70) to hit profit goals.
Track both MER and profit margin together. MER can improve while profit margin deteriorates if you're shifting to lower-margin products, increasing discounts, or seeing rising fulfillment costs. Monitor both metrics to ensure efficiency gains translate to bottom-line improvement.
Short-Term Optimization at Long-Term Expense
Optimizing for immediate MER can sacrifice investments in brand building, content, and organic channels that deliver compounding returns over time but show poor short-term metrics.
How to balance short and long-term efficiency:
Separate brand-building and performance marketing budgets with different MER expectations. Brand awareness campaigns might show MER of 2-3 initially but create lasting equity that improves efficiency of all future marketing. Performance marketing should hit higher MER targets (4-6+) immediately.
Track cohort performance over extended periods. Customers acquired when MER was temporarily lower due to brand investment may show superior lifetime value that justifies the initial efficiency sacrifice.
Invest in owned channels (email lists, social followers, content) that reduce future dependence on paid marketing. These investments might depress current MER but create sustainable, cost-effective revenue channels that dramatically improve long-term blended MER.
Putting It Into Practice
Effective MER usage requires understanding its limitations and using it as part of a comprehensive metrics framework rather than a standalone success measure. Set MER targets that support profitability while enabling growth, monitor it alongside margin and revenue metrics, and avoid the trap of optimizing efficiency at the expense of business objectives.
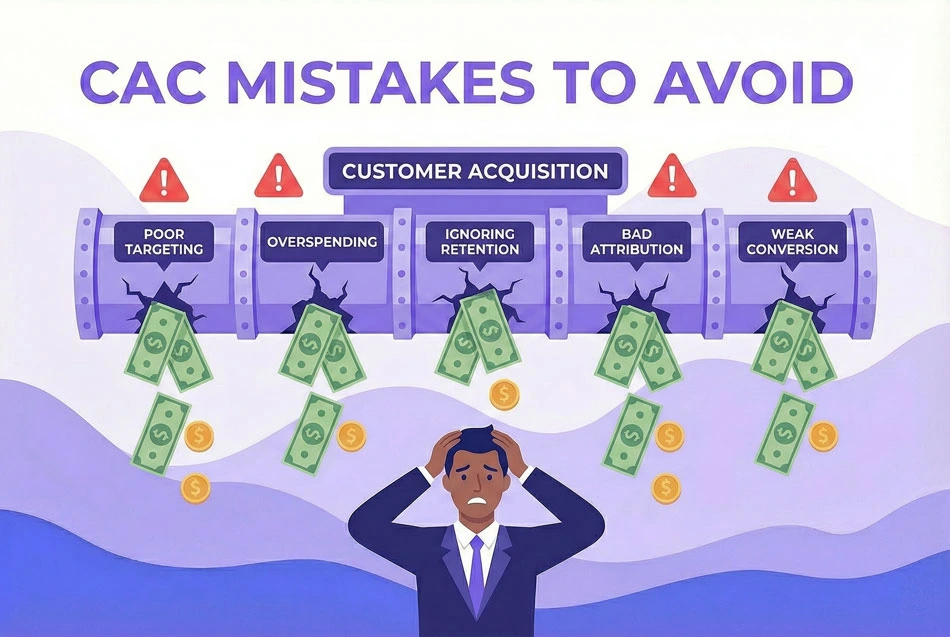
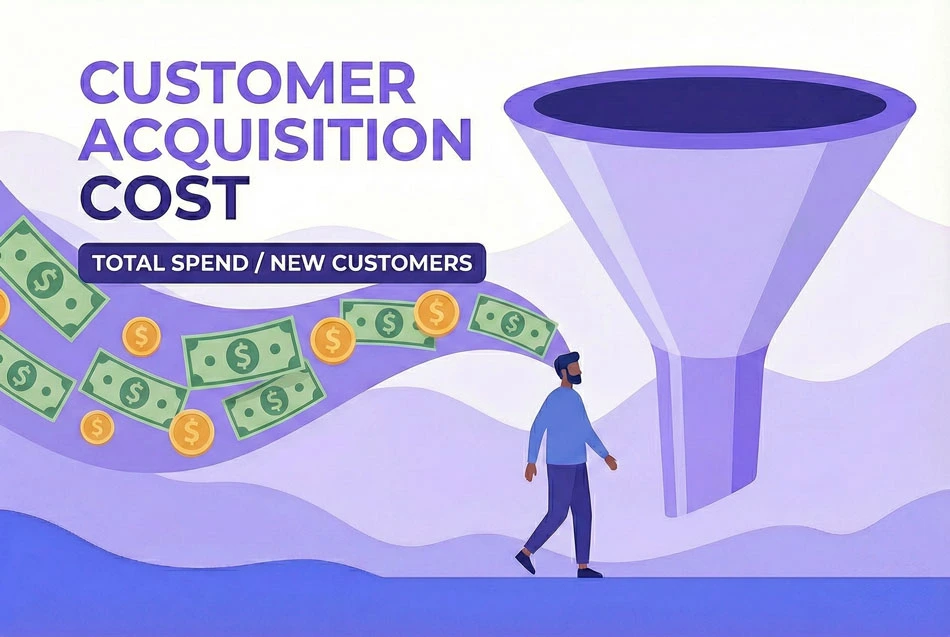
Common CAC Calculation Mistakes
Including All Relevant Costs
Many businesses underestimate CAC by only counting direct ad spend. True CAC includes employee salaries, marketing software, agency fees, content creation, promotional discounts, and overhead allocation.
Create a comprehensive cost tracking system that captures all acquisition expenses monthly. Most businesses discover their true CAC is 40-60% higher once all costs are properly included. If your marketing team splits time between acquisition and retention, allocate costs proportionally.
Using Proper Attribution
Last-click attribution ignores the multiple touchpoints before conversion. Customers interact with several ads across multiple sessions before purchasing, and last-click attribution undervalues awareness and consideration-stage marketing.
Implement multi-touch attribution models (linear, time-decay, or position-based) to understand true channel contribution. Track assisted conversions—a channel with poor last-click CAC might excel at assisting conversions that other channels close. Use view-through conversion tracking for display and video campaigns, and validate attribution models with holdout testing.
Balancing Cost and Quality
Lowering CAC without considering customer quality is counterproductive. Customers acquired at $20 CAC who never return underperform customers acquired at $80 CAC who become loyal repeat purchasers.
Track quality metrics alongside CAC: first order AOV, 90-day repeat rate, return rates, and LTV by channel. Set CAC targets by segment based on expected value, not uniform targets. Monitor how promotional intensity affects customer quality—heavy discounting may reduce immediate CAC but attracts low-quality customers with poor retention.
Optimization Tactics
Improve Targeting
Refined audience targeting reduces wasted spend on unlikely converters. Build lookalike audiences based on highest-LTV customers, not just any converters. Use negative targeting to exclude bargain hunters, serial returners, or incompatible demographics. Implement geographic targeting based on performance data—concentrate spending where conversion rates and LTV are strongest.
Leverage first-party data for precision targeting. Email lists, website visitors, and customer databases provide higher-intent audiences than cold prospecting. Test creative variations by segment—generic messaging fails to resonate and drives up CAC.
Enhance Conversion Rates
Every percentage point improvement in conversion rate proportionally reduces CAC. Optimize landing pages to match ad messaging, ensure fast load times, and include clear calls to action. Simplify checkout by reducing form fields and offering multiple payment options.
Implement trust signals: security badges, reviews, return policies, and testimonials reduce purchase anxiety. Use A/B testing systematically—small wins compound. Ensure mobile experience matches desktop, as mobile often represents 60%+ of traffic.
Leverage Retargeting
Retargeting warm audiences costs far less than cold prospecting. Segment by engagement level: product viewers, cart abandoners, and checkout abandoners require different messaging. Use dynamic ads showcasing products users viewed.
Implement frequency capping to avoid ad fatigue—showing the same ad 20 times wastes budget. Create sequential retargeting that addresses objections over time: remind, build trust, provide social proof, offer incentive.
Use Cost-Effective Channels
Email marketing nurtures leads at near-zero marginal cost. Invest in SEO for organic traffic that converts without per-click costs. Build community and organic social presence for word-of-mouth referrals. Create valuable content (guides, tools, calculators) that attracts high-intent traffic.
Negotiate Better Rates
Request volume discounts once you reach spending thresholds. Consider bulk ad purchases for cost advantages. Review vendor contracts regularly—market rates change. Explore alternative platforms—competitive pressure motivates better pricing.
Implementation Approach
Sustainable CAC reduction requires systematic execution. Establish baseline CAC and track weekly. Prioritize initiatives by impact and effort—quick wins build momentum while major initiatives deliver step-change improvements. Test changes incrementally through controlled experiments rather than wholesale shifts. Document learnings and apply insights across channels.
Focus on the fundamentals: include all costs in calculations, use proper attribution, improve targeting precision, optimize conversion rates, and leverage retargeting. These tactics compound over time, systematically reducing CAC while maintaining or improving customer quality.
The CAC:CLV Relationship
If your CAC exceeds your Customer Lifetime Value (CLV), you're spending more to acquire customers than they're worth—a path to unsustainable growth. Conversely, low CAC relative to CLV signals room to invest more aggressively in customer acquisition and scale your business.
The optimal CAC:CLV ratio is typically 1:3 or better. This means if you spend $50 to acquire a customer, they should generate at least $150 in lifetime profit. Ratios below 1:3 indicate overspending on acquisition; ratios above 1:5 suggest underinvestment in growth opportunities.
Profitability Analysis Framework
Track the right metrics:
● Calculate CAC:CLV ratio monthly. When it deteriorates, identify whether CAC is rising, CLV is falling, or both—each requires different fixes.
● Segment by customer cohort. January customers may have different lifetime values than June customers due to seasonality or promotional tactics.
● Evaluate against gross margin, not revenue. A $1,000 CLV at 20% margin ($200 profit) justifies far less CAC than $1,000 CLV at 60% margin ($600 profit).
● Monitor payback period. Even healthy ratios become problematic if it takes 24+ months to recoup acquisition costs. Target 12-month payback or less.
Channel Performance Analysis
Calculating CAC by channel reveals which marketing efforts deliver the most cost-effective customer acquisition. But don't evaluate channels on CAC alone.
Build comprehensive channel scorecards:
● Track CAC alongside AOV, repeat rate, and LTV. A $100 CAC channel outperforms a $50 CAC channel if it delivers customers with 3x higher LTV.
● Test incrementality by pausing channels. Some attractive-looking channels just intercept customers who would have converted anyway through other paths.
● Understand channel roles. Upper-funnel channels (display, social) may show high last-click CAC but drive crucial awareness that enables lower-funnel channels to convert efficiently.
● Experiment with channel combinations. Email nurture following social engagement or retargeting after content consumption often outperforms isolated channel efforts.
Setting Strategic CAC Targets
Different customer segments and channels justify different CAC levels based on expected value and business goals.
Strategic considerations:
● Establish minimum CAC:CLV ratios by segment. Premium customers with high retention might justify 1:2 ratios; promotional customers need 1:5 ratios to offset poor loyalty.
● Use cohort-based LTV for target setting. Customers acquired 12 months ago provide reliable LTV data; use this to set appropriate CAC targets for current acquisition.
● Build sensitivity models showing how retention or AOV changes impact allowable CAC. A 10% retention improvement might increase acceptable CAC by 30%.
● Balance growth and profitability objectives. Market share capture may accept lower ratios temporarily; profitability focus requires stricter ratios even if growth slows.
Putting It Into Practice
Effective CAC analysis requires comparing your acquisition costs against customer lifetime value, understanding channel-specific performance, and setting strategic targets based on business objectives. Track these metrics monthly, segment by cohort and channel, and use the insights to guide marketing investment decisions that balance growth with profitability.
Introduction
To truly optimize conversion rates and improve revenue in ecommerce, you need to go beyond just monitoring the overall sales conversion rate. While the sales conversion rate provides a top-level measure of your site's effectiveness in driving sales from visits, examining different event conversion rates can yield deeper insights into the customer journey and help pinpoint specific areas for improvement.
Analyzing 'Add to Cart' Conversion Rate
Looking at the add to cart conversion rate can reveal how well your product pages are convincing visitors to add items to their cart. If this rate is low, it might suggest that product descriptions, images, or the perceived value of the product aren't compelling enough.
Investigate page interactions, such as image scrolling or video plays, that are most likely to lead to an add to cart action. For instance, if high image gallery interaction correlates with high-performing product pages but is low on poorly performing ones, improving product imagery could be the key to boosting add-to-cart rates.
Key optimization strategies for add-to-cart conversion:
● Analyze which product page elements (image galleries, videos, size guides) correlate with higher add-to-cart rates on your best-performing products, then implement these features across underperforming pages.
● Test different product image styles and quantities—lifestyle photography versus white background, 360-degree views, or customer-submitted photos—to identify what resonates with your audience.
● Examine the relationship between time on page and add-to-cart actions. If visitors who spend more time convert better, focus on creating more engaging content. If quick visitors convert better, streamline your pages to reduce decision fatigue.
● Monitor scroll depth on product pages. If most add-to-cart actions happen after visitors scroll past certain content (like detailed specifications or reviews), ensure this critical content is prominently placed and easily accessible.
Examining Checkout Completion Rate
Checkout completion rate—the percentage of people who start the checkout process and actually complete their purchase—can highlight friction points causing cart abandonment. High drop-off rates during checkout may indicate issues like unexpected shipping costs, complicated checkout forms, or concerns about payment security.
By identifying these barriers, you can implement targeted optimizations such as streamlining the checkout process, offering free shipping thresholds, or enhancing payment security assurances.
Key optimization strategies for checkout completion:
● Track exactly where users abandon during checkout. If most drop off on the shipping page, costs may be too high or presented too late. If they leave on payment entry, security concerns or form complexity could be the issue.
● Test checkout length and complexity. Single-page checkouts often outperform multi-step processes, but this varies by industry and AOV. Higher-value purchases may benefit from a more considered multi-step approach that builds confidence.
● Ensure shipping costs are transparent early in the journey. Unexpected costs at checkout are the leading cause of cart abandonment. Display estimated shipping on product pages or offer free shipping thresholds to manage expectations.
● Offer multiple payment options. Different customers have different payment preferences, and lacking their preferred method can be a deal-breaker. Consider digital wallets, buy-now-pay-later options, and traditional payment methods.
● Implement trust signals throughout checkout: security badges, money-back guarantees, and customer service contact information. These reduce anxiety during the final, most critical stage of the purchase.
Taking Conversion Rate Analysis Further
Breaking down conversion rates even further allows analysis of the impact of specific elements on the user journey. By closely monitoring detailed event conversion rates and understanding the behaviors and interactions that lead to conversions, you can make data-driven decisions to optimize each step of the customer journey.
This granular approach not only leads to increasing sales conversion rates but also enhances the user experience, leading to higher customer satisfaction and long-term loyalty.
Advanced event conversion analysis:
● Track micro-conversions that indicate engagement: video plays, size guide opens, review reads, and zoom interactions. Understanding which interactions precede purchases helps you optimize for the behaviors that matter most.
● Segment conversion analysis by customer type. New versus returning visitors, different traffic sources, and various device types all show different conversion patterns. Personalize experiences based on these segments rather than applying one-size-fits-all optimizations.
● Analyze the time between events. How long between first visit and purchase? Between add-to-cart and checkout? Long delays might indicate comparison shopping or budget constraints, while very short times might signal impulse purchases. Design your follow-up strategies accordingly.
● Monitor assisted conversions and multi-touch journeys. Many customers don't convert on first visit. Understanding the typical path to conversion—which pages they visit, which channels they use, how many sessions they need—helps you optimize for real customer behavior rather than idealized single-session conversions.
Conclusion
Conversion Rate is an important metric for understanding how effectively your website converts visitors into customers. While the overall sales conversion rate provides valuable insights, analyzing specific conversion rates for different events along the customer journey offers deeper understanding and opportunities for optimization.
By analyzing and improving areas like add to cart rates and checkout completion rates, you can identify and address obstacles in the customer journey, leading to increased revenue and a better user experience. The key is moving beyond surface-level metrics to understand the specific behaviors and friction points that define your customers' experience, then systematically addressing each opportunity for improvement.
AOV is valuable for understanding transaction patterns, but focusing on it in isolation can lead to short-sighted strategies and customer experience issues.
Average Order Value (AOV) is a fundamental metric for understanding customer purchasing behavior and revenue potential — but relying on it too heavily can create blind spots in your strategy. Misusing AOV can damage customer relationships, skew your marketing decisions, and ultimately hurt profitability.
Here are three of the most common pitfalls businesses face when optimizing for AOV, and how to avoid them.
1. Overlooking Customer Diversity
Treating all customers the same based on a single AOV number can lead to one-size-fits-all strategies that alienate valuable segments. Not all customers have the same purchasing power, motivations, or buying patterns:
- High-value customers may respond well to premium bundles and exclusive offers
- Price-sensitive shoppers could be deterred by aggressive upselling or high minimum order thresholds
- First-time buyers need different treatment than loyal repeat customers who already trust your brand
Pushing tactics that increase AOV (like free shipping minimums or product bundles) uniformly across all segments can frustrate budget-conscious customers and reduce conversion rates, even if it lifts AOV among those who do purchase.
How to avoid it:
Segment your AOV data by customer type, traffic source, and purchase history. Analyze which segments naturally have higher AOV and which are more price-sensitive. Tailor your strategies accordingly — offer premium bundles to high-value segments while providing single-item options for price-conscious shoppers. This targeted approach increases AOV where it makes sense without sacrificing conversion rates across your entire customer base.
2. Sacrificing Customer Experience for Short-Term Gains
Aggressive tactics to boost AOV can backfire if they create friction or feel manipulative. Customers who feel pressured by heavy-handed upsells, forced bundles, or unreasonable free shipping thresholds may abandon their cart entirely — or worse, develop negative associations with your brand that hurt long-term retention.
Common experience-damaging tactics include:
- Pop-ups that interrupt checkout flow with excessive upsell offers
- Shipping thresholds set so high they feel unattainable for average shoppers
- Countdown timers and artificial scarcity designed to pressure purchases
- Auto-adding items to cart without clear customer consent
How to avoid it:
Balance AOV optimization with genuine value creation. Use tactics like "frequently bought together" recommendations that feel helpful rather than pushy, educational content that demonstrates why premium options deliver better results, and transparent shipping thresholds that align with typical purchase patterns. Monitor cart abandonment rates and customer feedback to ensure your AOV strategies aren't creating friction. A slightly lower AOV with happy, returning customers is far more valuable than maximizing one-time transaction values at the expense of retention.
3. Ignoring the Relationship with Other Key Metrics
AOV measures transaction size, but it exists within a broader ecosystem of metrics that determine actual business performance. Optimizing solely for AOV without considering its impact on conversion rate, customer acquisition cost (CAC), and customer lifetime value (CLV) can lead to counterproductive strategies:
- High free shipping thresholds may increase AOV but tank conversion rates, resulting in lower total revenue
- Minimum order requirements could boost average transaction size while making customer acquisition more expensive
- Premium-only product strategies might lift AOV but reduce addressable market and total order volume
A business with $75 AOV and 5% conversion rate generates far more revenue than one with $100 AOV and 2% conversion rate, even though the latter has "better" AOV.
How to avoid it:
Track AOV alongside conversion rate, total revenue, gross margin, CAC, and CLV to understand the full picture. Calculate your "effective revenue per visitor" (AOV × conversion rate) to see whether AOV optimization is actually improving business outcomes. Test AOV-focused strategies in controlled experiments and measure their impact on overall revenue and profitability, not just average transaction size. Remember that the goal isn't the highest possible AOV — it's the most profitable balance between transaction value, conversion efficiency, and customer satisfaction.
The Bottom Line
AOV is a valuable indicator of customer purchasing patterns and revenue potential, but it should never be optimized in isolation. By segmenting your approach for different customer types, prioritizing experience alongside transaction value, and analyzing AOV within the context of broader business metrics, you can avoid common pitfalls and build sustainable, profitable growth strategies.
Return on Ad Spend (ROAS) is a powerful metric for evaluating the efficiency of your advertising campaigns — but it’s not without its limitations. Misinterpreting or over-relying on ROAS can lead to poor strategic decisions, wasted budget, and missed growth opportunities.
Here are three of the most common pitfalls businesses face when using ROAS, and how to avoid them.
1. Ignoring Additional Costs
A high ROAS can look impressive on the surface, but it doesn’t tell the whole story. ROAS measures revenue generated against ad spend alone — it doesn’t factor in other costs that eat into profit, such as:
- Product returns and refunds
- Fulfilment and shipping costs
- Customer acquisition costs beyond paid ads (e.g., sales team time, onboarding)
If these expenses are significant, your true profitability could be far lower than your ROAS suggests.
How to avoid it:
Always review ROAS alongside broader financial metrics such as gross profit, net margin, and operating costs. This gives you a more accurate picture of campaign performance and prevents overestimating success.
2. Overlooking Customer Lifetime Value (CLV)
Many marketers focus on immediate ROAS results without considering the long-term value of the customers acquired. This is especially risky in subscription-based or repeat-purchase businesses, where the bulk of profit often comes months or years after the first sale.
How to avoid it:
Incorporate Customer Lifetime Value (CLV) into your analysis. A campaign with a low initial ROAS might still be highly profitable if it brings in customers who purchase repeatedly over time. Combining ROAS and CLV metrics helps you make decisions that drive sustainable growth, not just short-term wins.
3. Ignoring Variance in Product Margins
If your business sells products with different profit margins, a single ROAS target for all campaigns can be misleading. A campaign advertising a high-margin product may be profitable with a lower ROAS, while a low-margin product might require a much higher ROAS to break even.
How to avoid it:
Factor in product margins when setting ROAS targets. Use metrics like gross profit or contribution margin per sale to assess whether campaigns are truly profitable. This ensures that your ad strategy supports overall profitability rather than chasing arbitrary ratios.
The Bottom Line
ROAS is an essential metric for evaluating advertising performance, but it should never be viewed in isolation. By accounting for additional costs, considering customer lifetime value, and tailoring targets to product margins, you can avoid the most common pitfalls and make smarter, more profitable marketing decisions.
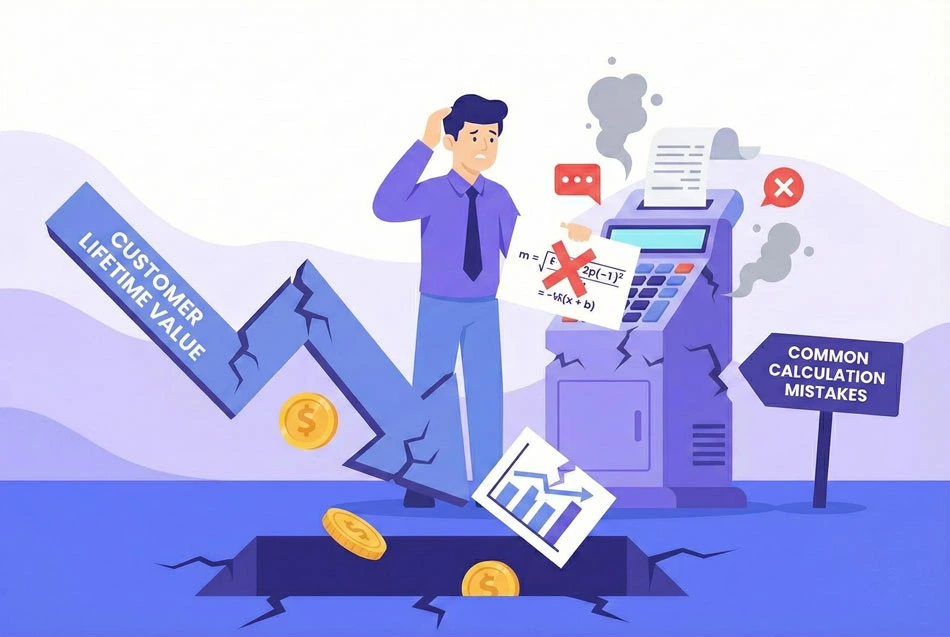
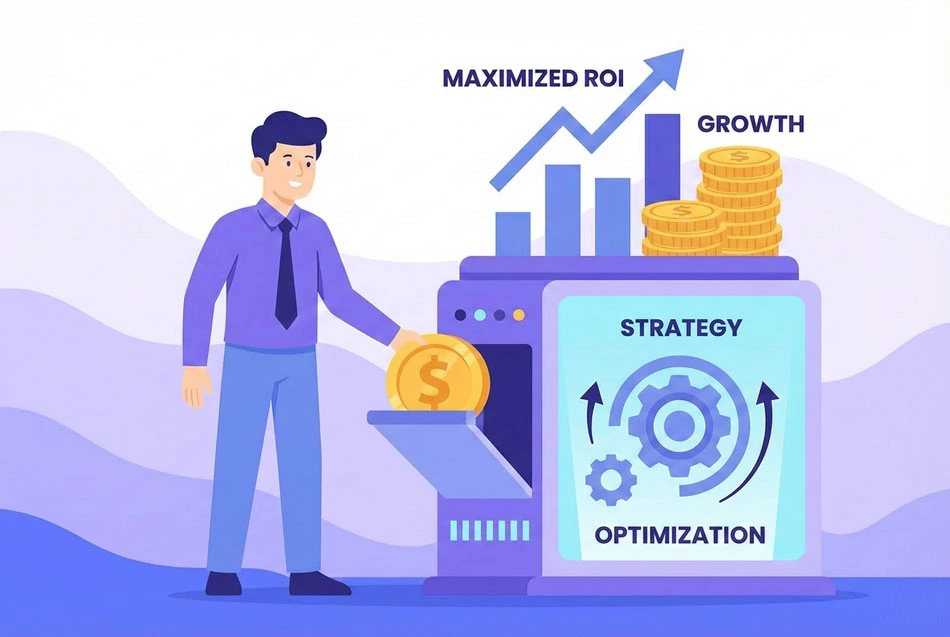
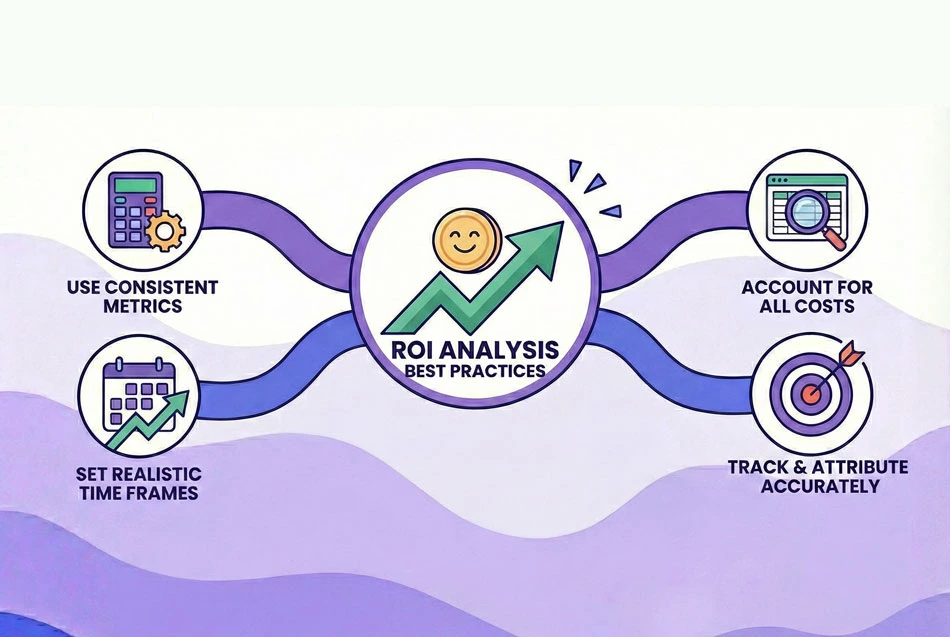
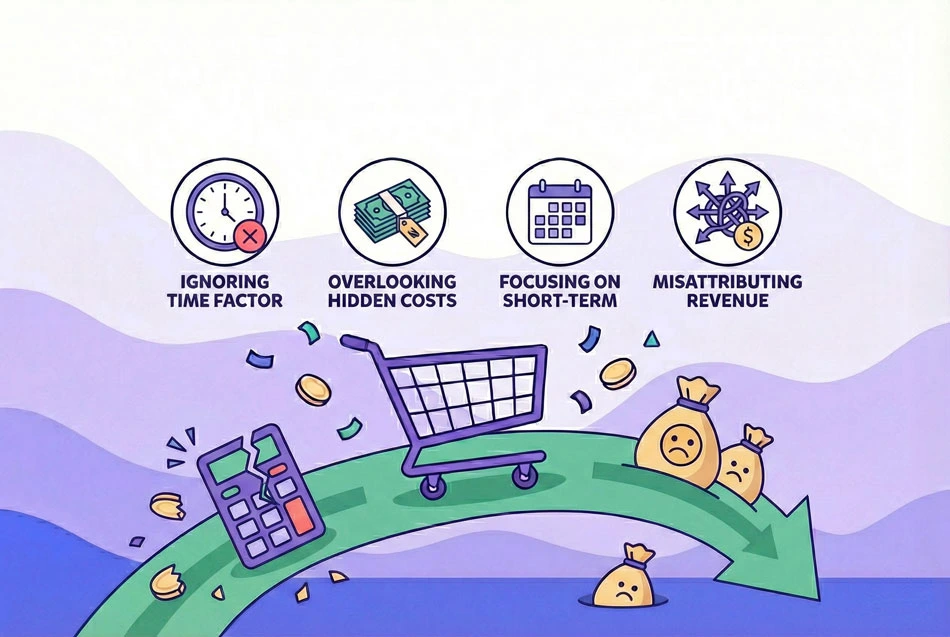
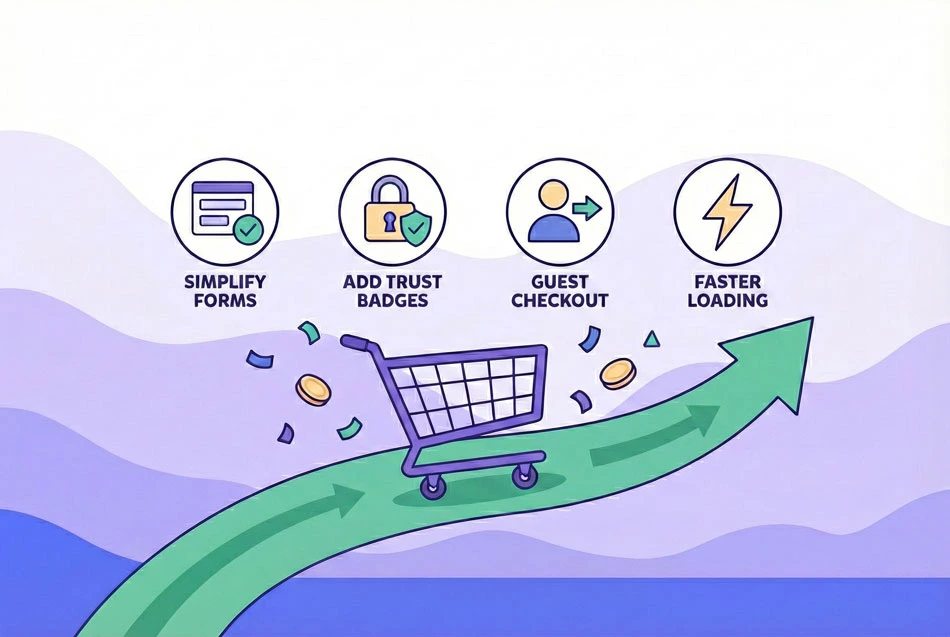
.webp)