Understanding ROAS
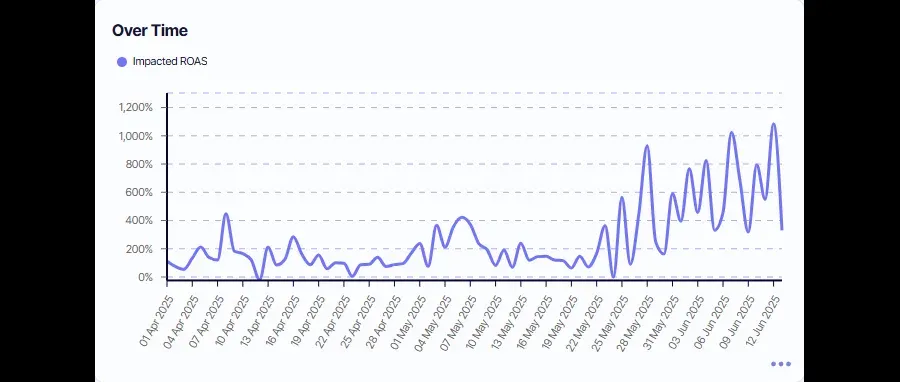
Return on Ad Spend (ROAS) is one of the most important metrics for evaluating the effectiveness of any advertising investment. By comparing the revenue generated to the amount spent on ads, ROAS provides a clear view of how efficiently your budget is being used. Whether you’re running digital campaigns, traditional media buys, or a mix of channels, tracking ROAS helps you identify which efforts are driving results and which need refinement. Mastering this metric enables better budget allocation, sharper strategy, and ultimately, stronger returns from your marketing spend.
How to Calculate ROAS
ROAS = Revenue from Ads / Ad Spend
Give it a go in our ROAS calculator!
ROAS Calculator
Calculation Example
Suppose your target ROAS needs to be 4.0 or higher to meet your profitability goals. If your total ad spend is $10,000, calculate the minimum revenue you need to generate:
Revenue = ROAS × Ad Spend
Revenue = 4 × $10,000
Revenue = $40,000
Aim to keep your revenue at or above $40,000 for every $10,000 in ad spend to maintain your desired ROAS.
Note: ROAS focuses purely on the revenue generated from your advertising spend. It does not account for other business costs like product manufacturing, fulfillment, or returns. For a true picture of profitability, consider pairing ROAS analysis with metrics such as gross margin or customer lifetime value.
What’s Considered a Healthy ROAS?
A “healthy” ROAS depends heavily on your industry, business model, and profit margins. While a 3:1 ratio (earning $3 in revenue for every $1 spent on ads) is often cited as a general benchmark, the right target varies:
● High-margin products or services can remain profitable with a lower ROAS (e.g., 2:1) because each sale yields more profit.
● Low-margin businesses may need a higher ROAS (4:1, 5:1 or more) to cover costs and stay viable.
● Early-stage growth campaigns may accept a lower ROAS temporarily if customer lifetime value (LTV) outweighs short-term returns.
Tip: Always calculate ROAS targets using your own cost structure rather than relying solely on industry norms. This ensures your ad spend is truly aligned with profitability.
ROAS FAQ
Should ROAS targets be different for prospecting and retargeting campaigns?
Yes. Retargeting usually converts warmer audiences and can achieve a higher ROAS, while prospecting often delivers a lower initial ROAS but builds your customer base for future growth.
How does ROAS change over a product’s lifecycle?
New product launches may have lower ROAS while awareness builds. Mature products often stabilise at a predictable ROAS, and declining products may see diminishing returns despite similar spend.
Can seasonal trends distort ROAS?
Absolutely. Holidays, sales periods, and market fluctuations can cause short-term spikes or dips in ROAS. Compare performance year-over-year for a truer picture of seasonal impacts.
How does attribution modelling affect ROAS?
Different attribution models (first-click, last-click, data-driven) can assign revenue credit differently, which changes your ROAS figures. Choose a model that aligns with your buying cycle and sales funnel.
Is there a risk in chasing the highest possible ROAS?
Yes. Maximising ROAS can lead to underspending on campaigns that grow your customer base but have lower short-term returns. This can stall overall business growth.
How should ROAS be tracked for subscription businesses?
For recurring revenue models, consider calculating ROAS based on projected customer lifetime revenue rather than just first-purchase revenue.
What role does creative testing play in improving ROAS?
Creative fatigue can lower ROAS over time. Regularly testing and refreshing ad creatives can maintain engagement and improve efficiency.
Should I measure ROAS at the channel, campaign, or ad level?
All three can provide valuable insights. Channel-level ROAS guides budget allocation, campaign-level ROAS reveals strategy effectiveness, and ad-level ROAS helps optimise individual creatives.