
AOV
ROAS reveals how much revenue your ads generate for every dollar spent — and whether that spend is truly working for you. Learn how to calculate it and apply it to maximize your marketing returns.
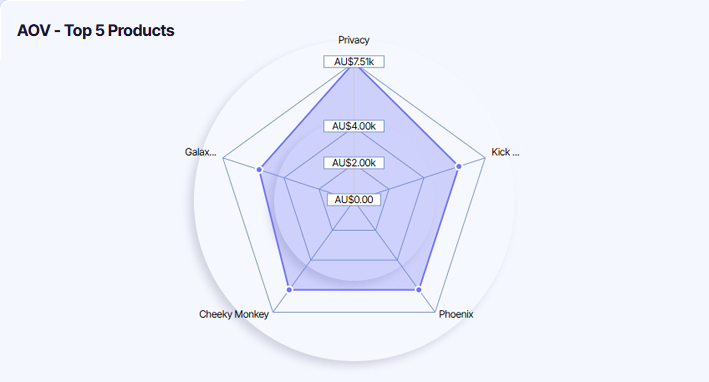
Understanding Average Order Value (AOV)
For ecommerce businesses aiming to understand customer purchasing behavior, Average Order Value (AOV) is a key metric. AOV measures the average dollar amount spent each time a customer places an order on your website. This metric provides insights into how much revenue you generate per transaction and helps strategize ways to increase revenue, without necessarily increasing the number of customers.
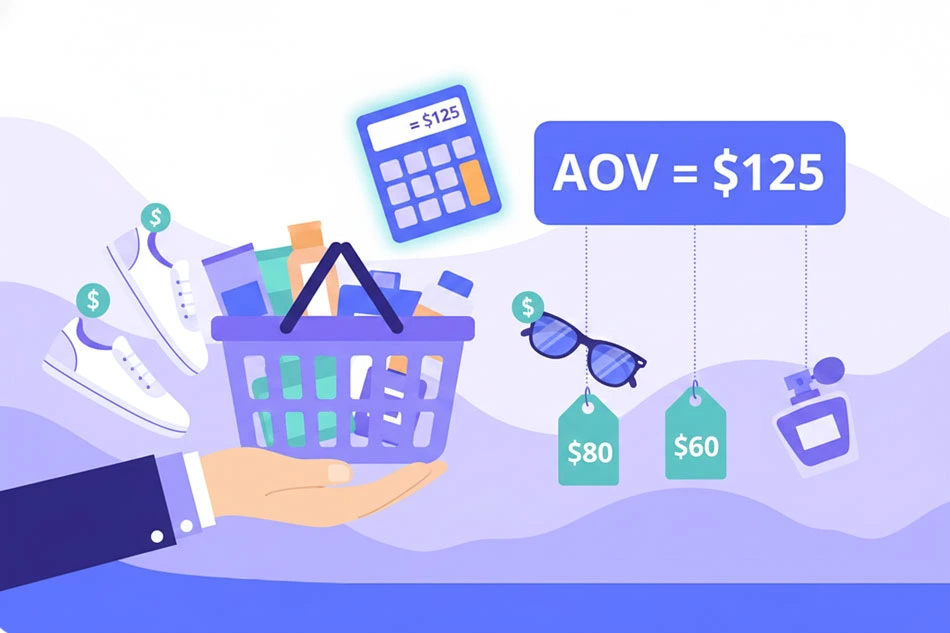
How to Calculate AOV
AOV = Total Revenue / Number of Orders
Give it a go in our AOV calculator!
AOV Calculator
Calculation Example
Suppose your target AOV needs to be $75 or higher to meet your profitability goals. If you've had 500 orders this month, calculate the minimum revenue you need to generate:
Revenue = AOV × Number of Orders
Revenue = $75 × 500
Revenue = $37,500
Aim to keep your revenue at or above $37,500 for every 500 orders to maintain your desired AOV.
Note: AOV offers a clear view of your customers' average spending patterns but doesn't account for individual customer lifetime value or variability in customer behavior. It focuses solely on the average amount spent per order, making it valuable for assessing your overall pricing strategy and identifying opportunities to increase revenue per customer.

What’s Considered a Healthy AOV?
A "healthy" AOV depends heavily on your industry, product pricing, and profit margins. While benchmarks vary widely, the right target for your business should support profitable unit economics:
● High-margin products (furniture, electronics, jewelry) naturally have higher AOV ($200-$500+) but may require longer sales cycles and higher customer acquisition costs.
● Low-margin businesses (consumables, accessories, digital products) typically see lower AOV ($30-$80) but can achieve profitability through volume, repeat purchases, and lower fulfillment costs.
● Subscription or replenishment models may accept lower initial AOV ($25-$50) if customer lifetime value and retention rates justify the economics over multiple purchases.
Tip: The key is ensuring your AOV provides sufficient gross profit to cover customer acquisition costs, operational expenses, and desired margins—not chasing arbitrary industry benchmarks.
AOV FAQ
How can I increase my AOV without discounting?
Should AOV be measured differently for new vs. returning customers?
Does a high AOV always mean better profitability?
How does AOV relate to customer acquisition cost (CAC)?
Should I track AOV by traffic source or marketing channel?
Is there a risk in focusing too heavily on increasing AOV?

All-in-one platform, for ecommerce and B2B.
