CR

(Conversion Rate)

Conversion Rate measures the percentage of website visitors who complete a desired action—typically making a purchase. This fundamental ecommerce metric reveals how effectively your site turns traffic into customers and revenue. Learn how to calculate it and apply it to maximize your marketing returns.

Table of Contents
Understanding CRHow to Calculate CRWhat’s Considered a Healthy CR?CR FAQ
Learning more?
Apply what you know in a platform that measures up!
Try Incendium

Understanding Conversion Rate

Conversion Rate is a fundamental metric in ecommerce that tells you how effectively your website or marketing efforts are encouraging visitors to perform specific actions. A high conversion rate indicates that your site is effectively engaging visitors and driving them to complete desired actions, whether that's signing up for a newsletter, filling out a form, or making a purchase. Understanding Conversion Rate helps you to evaluate the effectiveness of your marketing strategies and the overall user experience on your site.

How to Calculate CR

CR = Number of Conversions / Total Number of Visits

Give it a go in our Conversion Rate calculator!

Conversion Rate Calculator

Conversion Rate:
Thank you! Your submission has been received!
Oops! Something went wrong while submitting the form.

Calculation Example

Suppose your profitability model requires at least a 3% conversion rate to maintain acceptable customer acquisition costs. You're planning a marketing campaign that will drive 10,000 visitors to your site this month. Calculate the minimum number of conversions you need to achieve your target:

Number of Conversions = Conversion Rate × Total Visits

Number of Conversions = 0.03 × 10,000

Number of Conversions = 300 orders

Aim to generate at least 300 orders from those 10,000 visitors to maintain your target 3% conversion rate and keep your marketing spend profitable.

Note: The calculation above is for session conversion rate, which is the most commonly used. Alternatively, you could look at lead conversion rate, where you divide the number of conversions by the number of individual visitors. If the same visitor comes back three times, they're counted only once. This helps you understand how many unique visitors convert, giving insight into the effectiveness of your site in converting individual users.

What Tools Measure LTV:CAC Ratio?

You’d think calculating your LTV:CAC ratio would be straightforward — but surprisingly, most tools don’t make it easy.

This metric requires connecting costs with customer value over time — something very few platforms are built to do natively. Let’s break down where you can get this data, where the gaps are, and how Incendium fills them.

GA4: Can You Measure LTV:CAC?

Not easily. GA4 doesn’t show customer acquisition cost at all, and its Lifetime Value report is:

● Hidden under the “Explore” tab.

● Limited to revenue per user over a fixed period (e.g. 90 days).

● Lacking cohort-level breakdowns.

● Not connected to ad spend or margin data.

So while you can approximate parts of LTV in GA4, you’ll need spreadsheets to:

● Pull in ad costs from Google Ads, Meta, etc.

● Match spend to customer cohorts.

● Adjust for churn, returns, or contribution margin.

It’s doable — but; manual, error-prone, and not scalable.

❌ No CAC
❌ No contribution margin
❌ No retention-based LTV
❌ No channel or campaign granularity

Spreadsheet-Based Models

Many marketers and finance teams rely on custom spreadsheet models. These usually involve:

● Exporting revenue data from Shopify or GA4.

● Pulling in ad costs from platforms like Meta or Google.

● Matching acquisition dates to cohorts.

● Calculating LTV over time.

● Segmenting CAC by channel (if possible).

This can work for small teams — but:

● It's time-consuming.

● Easy to break as your business grows.

● Difficult to segment and troubleshoot.

● Hard to update frequently enough to make real-time decisions.

✅ Flexible
❌ Time-consuming
❌ Not real-time
❌ High error risk

Incendium: LTV:CAC Done Right

Incendium was built for this. It automatically connects:

● Ad platform spend (Google, Meta, TikTok, etc).

● Revenue and margins (from Shopify, Stripe, etc).

● Customer retention curves.

● Channel and campaign attribution.

● Cohort-based performance over time.

Then it presents your true LTV:CAC ratios — by channel, campaign, customer segment, and acquisition cohort — without the need for spreadsheets.

Whether you want to:

● See if paid search is actually profitable.

● Compare returning vs new customers.

● Measure payback periods.

● Or optimize toward high-LTV audiences.

…you’ll have it, instantly.

✅ Automated
✅ Channel + cohort breakdowns
✅ Margin-based LTV
✅ Attribution-integrated
✅ Real-time, self-updating

What’s Considered a Healthy CR?

A "healthy" conversion rate varies significantly by industry, traffic source, and product type. While ecommerce averages typically range from 2-3%, the right target for your business depends on multiple factors:

Industry and product type heavily influence benchmarks. Luxury goods or high-ticket items (furniture, electronics) often see lower conversion rates (1-2%) due to longer consideration periods, while consumables or replenishment products (supplements, cosmetics) typically achieve higher rates (3-5%+) as purchase decisions are faster.
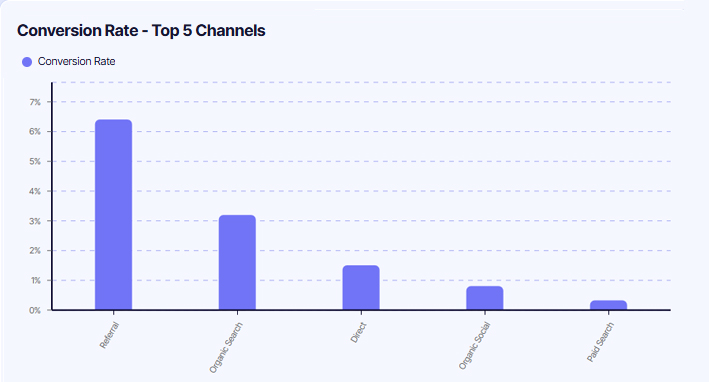
Traffic quality matters more than volume. Highly targeted traffic from email campaigns or branded search may convert at 5-10%, while cold social media traffic might convert at 0.5-1%. A lower conversion rate from high-intent traffic signals optimization opportunities, while low conversion from awareness-stage traffic may be expected.

New vs. returning visitors show dramatically different patterns. First-time visitors typically convert at 1-2% as they're discovering your brand, while returning visitors often convert at 3-5x that rate due to established trust and familiarity.

Device and experience optimization impacts results. Mobile conversion rates are typically 30-50% lower than desktop, not because of user intent but due to friction in the mobile experience. If your mobile rate is dramatically lower, it signals UX improvements are needed.

Tip: The key is establishing your baseline, then systematically improving it through testing and optimization rather than chasing arbitrary industry benchmarks that may not reflect your specific business model.

CR FAQ

What Tools Measure LTV:CAC Ratio?

You’d think calculating your LTV:CAC ratio would be straightforward — but surprisingly, most tools don’t make it easy.

This metric requires connecting costs with customer value over time — something very few platforms are built to do natively. Let’s break down where you can get this data, where the gaps are, and how Incendium fills them.

GA4: Can You Measure LTV:CAC?

Not easily. GA4 doesn’t show customer acquisition cost at all, and its Lifetime Value report is:

● Hidden under the “Explore” tab.

● Limited to revenue per user over a fixed period (e.g. 90 days).

● Lacking cohort-level breakdowns.

● Not connected to ad spend or margin data.

So while you can approximate parts of LTV in GA4, you’ll need spreadsheets to:

● Pull in ad costs from Google Ads, Meta, etc.

● Match spend to customer cohorts.

● Adjust for churn, returns, or contribution margin.

It’s doable — but; manual, error-prone, and not scalable.

❌ No CAC
❌ No contribution margin
❌ No retention-based LTV
❌ No channel or campaign granularity

Spreadsheet-Based Models

Many marketers and finance teams rely on custom spreadsheet models. These usually involve:

● Exporting revenue data from Shopify or GA4.

● Pulling in ad costs from platforms like Meta or Google.

● Matching acquisition dates to cohorts.

● Calculating LTV over time.

● Segmenting CAC by channel (if possible).

This can work for small teams — but:

● It's time-consuming.

● Easy to break as your business grows.

● Difficult to segment and troubleshoot.

● Hard to update frequently enough to make real-time decisions.

✅ Flexible
❌ Time-consuming
❌ Not real-time
❌ High error risk

Incendium: LTV:CAC Done Right

Incendium was built for this. It automatically connects:

● Ad platform spend (Google, Meta, TikTok, etc).

● Revenue and margins (from Shopify, Stripe, etc).

● Customer retention curves.

● Channel and campaign attribution.

● Cohort-based performance over time.

Then it presents your true LTV:CAC ratios — by channel, campaign, customer segment, and acquisition cohort — without the need for spreadsheets.

Whether you want to:

● See if paid search is actually profitable.

● Compare returning vs new customers.

● Measure payback periods.

● Or optimize toward high-LTV audiences.

…you’ll have it, instantly.

✅ Automated
✅ Channel + cohort breakdowns
✅ Margin-based LTV
✅ Attribution-integrated
✅ Real-time, self-updating