CAC

(Customer Acquisition Cost)

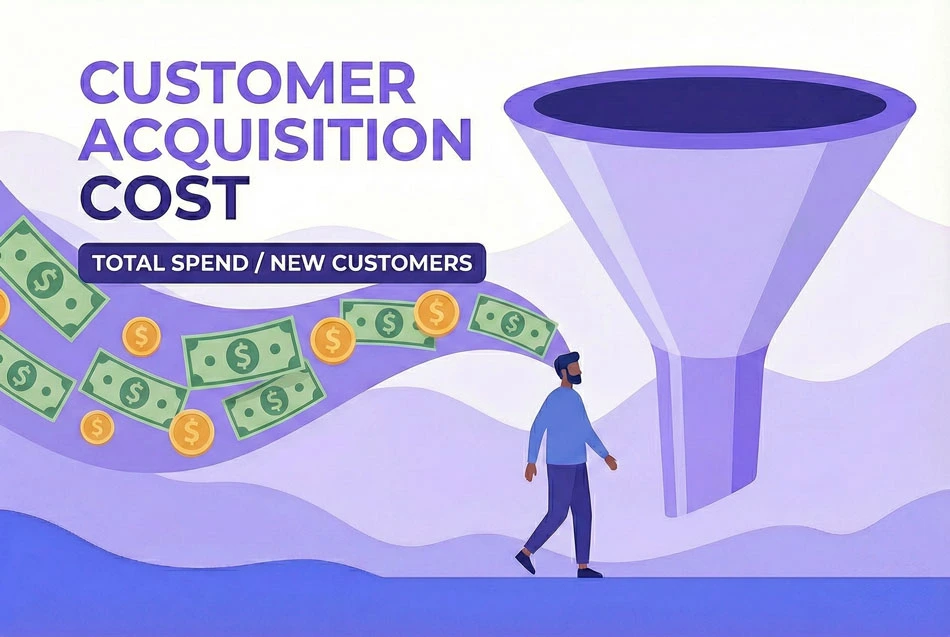
Customer Acquisition Cost (CAC) measures the total cost of acquiring a new customer, encompassing all marketing and sales expenses. Understanding this metric is essential for assessing campaign profitability and scaling your business sustainably.

Table of Contents
Understanding CACHow to Calculate CACWhat’s Considered a Healthy CAC?CAC FAQ
Learning more?
Apply what you know in a platform that measures up!
Try Incendium

Understanding CAC

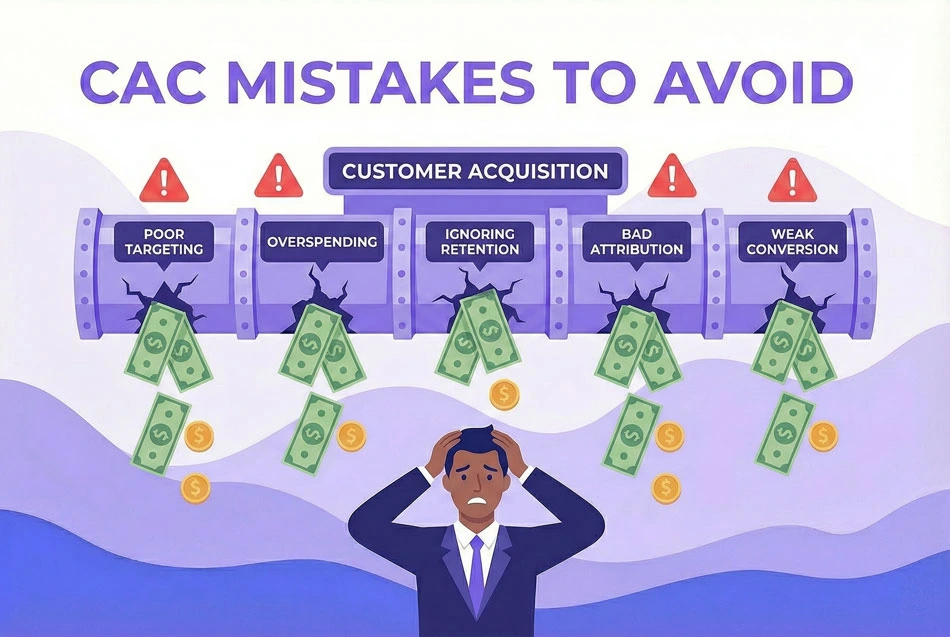
Customer Acquisition Cost measures how much you're spending to bring in each customer, which is essential for assessing the profitability of your marketing campaigns and deciding where to allocate resources. A high CAC might indicate overspending on customer acquisition or targeting the wrong audience, while a low CAC suggests efficient customer attraction, allowing more room for profit. Understanding this metric is the gateway to scaling your business sustainably.

While calculating Customer Acquisition Cost seems straightforward, it's essential to ensure you're including all related costs. This includes direct advertising spend, salaries, software tools, agency fees, and any other expenses tied to customer acquisition. Attribution also plays a crucial role; relying solely on last-click attribution (a marketing model which counts the customer's final touchpoint before a purchase as the reason for the conversion) can ignore the real effort involved in converting a user. Customers may interact with multiple ads and sessions before making a purchase, so understanding the entire customer journey is important for accurate CAC calculation.

How to Calculate CAC

CAC = Total Sales and Marketing Expenses / Number of New Customers Acquired

Give it a go in our CAC calculator!

CAC Calculator

Customer Acquisition Cost:
Thank you! Your submission has been received!
Oops! Something went wrong while submitting the form.

Calculation Example

Suppose your business model requires keeping CAC at or below $75 to maintain profitability against your customer lifetime value targets. You're planning a quarterly marketing budget of $45,000. Calculate the minimum number of new customers you need to acquire to stay within your target CAC:

Number of New Customers = Total Marketing Expenses / Target CAC

Number of New Customers = $45,000 / $75

Number of New Customers = 600 Customers

Aim to acquire at least 600 new customers from your $45,000 quarterly marketing spend to maintain your target $75 CAC and ensure profitable customer acquisition.

What Tools Measure LTV:CAC Ratio?

You’d think calculating your LTV:CAC ratio would be straightforward — but surprisingly, most tools don’t make it easy.

This metric requires connecting costs with customer value over time — something very few platforms are built to do natively. Let’s break down where you can get this data, where the gaps are, and how Incendium fills them.

GA4: Can You Measure LTV:CAC?

Not easily. GA4 doesn’t show customer acquisition cost at all, and its Lifetime Value report is:

● Hidden under the “Explore” tab.

● Limited to revenue per user over a fixed period (e.g. 90 days).

● Lacking cohort-level breakdowns.

● Not connected to ad spend or margin data.

So while you can approximate parts of LTV in GA4, you’ll need spreadsheets to:

● Pull in ad costs from Google Ads, Meta, etc.

● Match spend to customer cohorts.

● Adjust for churn, returns, or contribution margin.

It’s doable — but; manual, error-prone, and not scalable.

❌ No CAC
❌ No contribution margin
❌ No retention-based LTV
❌ No channel or campaign granularity

Spreadsheet-Based Models

Many marketers and finance teams rely on custom spreadsheet models. These usually involve:

● Exporting revenue data from Shopify or GA4.

● Pulling in ad costs from platforms like Meta or Google.

● Matching acquisition dates to cohorts.

● Calculating LTV over time.

● Segmenting CAC by channel (if possible).

This can work for small teams — but:

● It's time-consuming.

● Easy to break as your business grows.

● Difficult to segment and troubleshoot.

● Hard to update frequently enough to make real-time decisions.

✅ Flexible
❌ Time-consuming
❌ Not real-time
❌ High error risk

Incendium: LTV:CAC Done Right

Incendium was built for this. It automatically connects:

● Ad platform spend (Google, Meta, TikTok, etc).

● Revenue and margins (from Shopify, Stripe, etc).

● Customer retention curves.

● Channel and campaign attribution.

● Cohort-based performance over time.

Then it presents your true LTV:CAC ratios — by channel, campaign, customer segment, and acquisition cohort — without the need for spreadsheets.

Whether you want to:

● See if paid search is actually profitable.

● Compare returning vs new customers.

● Measure payback periods.

● Or optimize toward high-LTV audiences.

…you’ll have it, instantly.

✅ Automated
✅ Channel + cohort breakdowns
✅ Margin-based LTV
✅ Attribution-integrated
✅ Real-time, self-updating

What’s Considered a Healthy CAC?

A "healthy" CAC depends entirely on your business model, profit margins, and customer lifetime value (CLV). The fundamental rule is that CAC must be significantly lower than CLV to ensure sustainable growth:

The CAC:CLV ratio is critical. Most successful ecommerce businesses aim for a 1:3 ratio, meaning if your CAC is $100, your customer lifetime value should be at least $300. Ratios below 1:3 indicate you're spending too much relative to customer value, while ratios above 1:5 suggest you may be under-investing in growth opportunities.

Payback period matters as much as the ratio. Even with a healthy 1:3 CAC:CLV ratio, if it takes 24 months to recoup your acquisition cost, cash flow constraints could strangle growth. Aim for CAC payback within 12 months or less, ideally through first purchase plus early repeat orders.

Industry and business model create wide variation. Subscription businesses can support higher CAC ($200-500) due to predictable recurring revenue, while low-margin consumables need much lower CAC ($20-50) to remain profitable. Luxury or high-ticket items ($500+ AOV) can justify CAC of $100-200, whereas fast-fashion or commodity products need CAC below $30.

Customer type significantly impacts acceptable CAC. First-time customer acquisition typically costs 5-7x more than retaining existing customers. If your CAC is $80 but 40% of revenue comes from repeat customers acquired at near-zero cost, your blended economics may still be strong even if new customer CAC seems high.
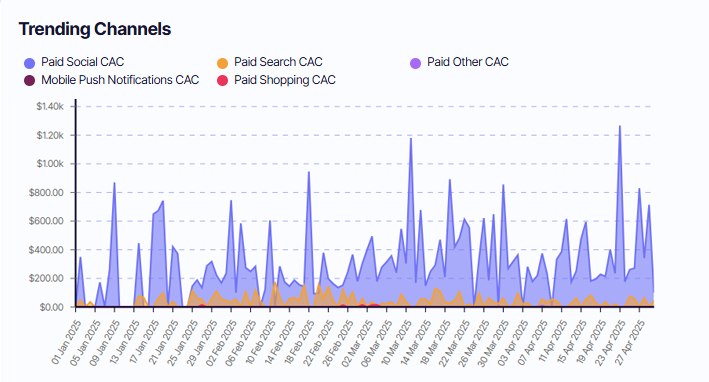
Channel efficiency varies dramatically. Branded search might deliver $15 CAC, while cold prospecting on social media could run $150+ CAC. The key is ensuring each channel's CAC is profitable within that channel's context, not expecting uniform costs across all acquisition methods.

Tip: The most important benchmark isn't an industry average—it's whether your CAC enables profitable growth at your desired scale. Calculate your unit economics carefully, understanding both immediate profitability and the full customer journey economics.

CAC FAQ

What Tools Measure LTV:CAC Ratio?

You’d think calculating your LTV:CAC ratio would be straightforward — but surprisingly, most tools don’t make it easy.

This metric requires connecting costs with customer value over time — something very few platforms are built to do natively. Let’s break down where you can get this data, where the gaps are, and how Incendium fills them.

GA4: Can You Measure LTV:CAC?

Not easily. GA4 doesn’t show customer acquisition cost at all, and its Lifetime Value report is:

● Hidden under the “Explore” tab.

● Limited to revenue per user over a fixed period (e.g. 90 days).

● Lacking cohort-level breakdowns.

● Not connected to ad spend or margin data.

So while you can approximate parts of LTV in GA4, you’ll need spreadsheets to:

● Pull in ad costs from Google Ads, Meta, etc.

● Match spend to customer cohorts.

● Adjust for churn, returns, or contribution margin.

It’s doable — but; manual, error-prone, and not scalable.

❌ No CAC
❌ No contribution margin
❌ No retention-based LTV
❌ No channel or campaign granularity

Spreadsheet-Based Models

Many marketers and finance teams rely on custom spreadsheet models. These usually involve:

● Exporting revenue data from Shopify or GA4.

● Pulling in ad costs from platforms like Meta or Google.

● Matching acquisition dates to cohorts.

● Calculating LTV over time.

● Segmenting CAC by channel (if possible).

This can work for small teams — but:

● It's time-consuming.

● Easy to break as your business grows.

● Difficult to segment and troubleshoot.

● Hard to update frequently enough to make real-time decisions.

✅ Flexible
❌ Time-consuming
❌ Not real-time
❌ High error risk

Incendium: LTV:CAC Done Right

Incendium was built for this. It automatically connects:

● Ad platform spend (Google, Meta, TikTok, etc).

● Revenue and margins (from Shopify, Stripe, etc).

● Customer retention curves.

● Channel and campaign attribution.

● Cohort-based performance over time.

Then it presents your true LTV:CAC ratios — by channel, campaign, customer segment, and acquisition cohort — without the need for spreadsheets.

Whether you want to:

● See if paid search is actually profitable.

● Compare returning vs new customers.

● Measure payback periods.

● Or optimize toward high-LTV audiences.

…you’ll have it, instantly.

✅ Automated
✅ Channel + cohort breakdowns
✅ Margin-based LTV
✅ Attribution-integrated
✅ Real-time, self-updating