LTV

(Customer Lifetime Value)

Customer Lifetime Value (LTV), also known as CLV, represents the total revenue you can expect from a customer over their entire relationship with your business. Understanding LTV helps you make informed decisions about acquisition spending and retention investment.

Table of Contents
Understanding LTVHow to Calculate LTVWhat’s Considered a Healthy LTV?LTV FAQ
Learning more?
Apply what you know in a platform that measures up!
Try Incendium

Understanding LTV

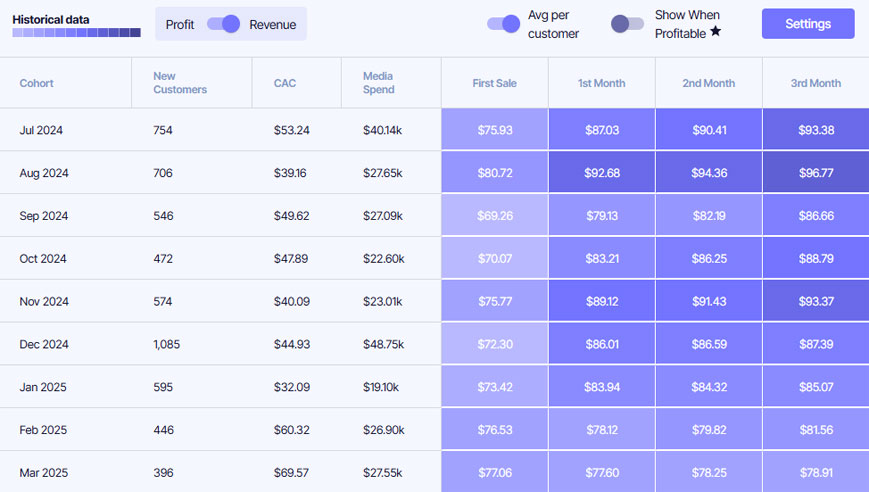
LTV is a critical metric that extends your understanding of marketing performance beyond the first conversion. It tells you how much revenue a customer generates throughout their lifetime with your company, usually presented as an average across your customer base. This metric matters because it identifies and highlights high-value customers who contribute significantly to your profitability.

LTV enables you to make informed decisions about how much to invest in acquiring new customers and retaining existing ones, ultimately driving long-term profitability. By understanding the total value a customer brings over time, you can justify higher acquisition costs for customers who will generate significant long-term returns, while avoiding overspending on low-value customer segments.

How to Calculate LTV

LTV = Average Order Value × Average Purchase Frequency × Average Customer Lifespan

Give it a go in our ROI calculator!

LTV Calculator

Customer Lifetime Value:
Thank you! Your submission has been received!
Oops! Something went wrong while submitting the form.

Calculation Example

Suppose your business model requires an LTV of at least $800 to justify your current customer acquisition costs and maintain profitability. Your customers currently make purchases 3 times per year with an average order value of $60. Calculate the minimum customer lifespan you need to achieve your target LTV:

Customer Lifespan = Target LTV / (AOV × Purchase Frequency)

Customer Lifespan = $800 / ($60 × 3)

Customer Lifespan = $800 / $180 = 4.4 years

Aim to retain customers for at least 4.4 years through retention strategies, loyalty programs, and excellent service to achieve your target $800 LTV and maintain profitable unit economics.

What Tools Measure LTV:CAC Ratio?

You’d think calculating your LTV:CAC ratio would be straightforward — but surprisingly, most tools don’t make it easy.

This metric requires connecting costs with customer value over time — something very few platforms are built to do natively. Let’s break down where you can get this data, where the gaps are, and how Incendium fills them.

GA4: Can You Measure LTV:CAC?

Not easily. GA4 doesn’t show customer acquisition cost at all, and its Lifetime Value report is:

● Hidden under the “Explore” tab.

● Limited to revenue per user over a fixed period (e.g. 90 days).

● Lacking cohort-level breakdowns.

● Not connected to ad spend or margin data.

So while you can approximate parts of LTV in GA4, you’ll need spreadsheets to:

● Pull in ad costs from Google Ads, Meta, etc.

● Match spend to customer cohorts.

● Adjust for churn, returns, or contribution margin.

It’s doable — but; manual, error-prone, and not scalable.

❌ No CAC
❌ No contribution margin
❌ No retention-based LTV
❌ No channel or campaign granularity

Spreadsheet-Based Models

Many marketers and finance teams rely on custom spreadsheet models. These usually involve:

● Exporting revenue data from Shopify or GA4.

● Pulling in ad costs from platforms like Meta or Google.

● Matching acquisition dates to cohorts.

● Calculating LTV over time.

● Segmenting CAC by channel (if possible).

This can work for small teams — but:

● It's time-consuming.

● Easy to break as your business grows.

● Difficult to segment and troubleshoot.

● Hard to update frequently enough to make real-time decisions.

✅ Flexible
❌ Time-consuming
❌ Not real-time
❌ High error risk

Incendium: LTV:CAC Done Right

Incendium was built for this. It automatically connects:

● Ad platform spend (Google, Meta, TikTok, etc).

● Revenue and margins (from Shopify, Stripe, etc).

● Customer retention curves.

● Channel and campaign attribution.

● Cohort-based performance over time.

Then it presents your true LTV:CAC ratios — by channel, campaign, customer segment, and acquisition cohort — without the need for spreadsheets.

Whether you want to:

● See if paid search is actually profitable.

● Compare returning vs new customers.

● Measure payback periods.

● Or optimize toward high-LTV audiences.

…you’ll have it, instantly.

✅ Automated
✅ Channel + cohort breakdowns
✅ Margin-based LTV
✅ Attribution-integrated
✅ Real-time, self-updating

What’s Considered a Healthy LTV?

A "healthy" ROI depends on your business model, profit margins, industry, and growth stage, but understanding the fundamental economics is critical:

LTV:CAC ratio is the fundamental health metric. Most successful ecommerce businesses target a 3:1 ratio minimum—if CAC is $100, LTV should be at least $300. Ratios below 3:1 suggest overspending on acquisition relative to customer value; ratios above 5:1 indicate potential underinvestment in growth opportunities.

Industry and business model create wide variation. Subscription businesses (software, consumables, memberships) often show LTV of $500-5,000+ due to predictable recurring revenue. One-time purchase businesses (furniture, appliances, special occasion items) typically see lower LTV ($200-800) as customers buy infrequently. Fashion and beauty with strong repeat patterns show LTV of $300-1,200.

Product margin determines viable LTV floors. High-margin businesses (60-80% gross margin) can operate profitably with lower absolute LTV because each purchase contributes significant profit. Low-margin businesses (20-30% gross margin) need higher LTV to generate equivalent profit dollars. Always evaluate LTV in context of margin structure.

Payback period matters alongside absolute LTV. A customer with $1,000 LTV realized over 4 years is less valuable than one with $1,000 LTV realized over 12 months due to cash flow and reinvestment considerations. Target LTV payback within 12-18 months for healthy cash flow dynamics.

Customer segment variation is normal and valuable. Email subscribers might show LTV of $800 while social media acquires show $300 LTV. Geographic segments, demographic cohorts, and product category preferences all create LTV variation. This diversity enables targeted acquisition strategies rather than one-size-fits-all approaches.

Tip: The most important benchmark isn't an absolute LTV number—it's whether your LTV supports profitable customer acquisition at scale while maintaining healthy cash flow. Calculate your target LTV based on desired LTV:CAC ratio, available acquisition channels, and margin structure.

LTV FAQ

What Tools Measure LTV:CAC Ratio?

You’d think calculating your LTV:CAC ratio would be straightforward — but surprisingly, most tools don’t make it easy.

This metric requires connecting costs with customer value over time — something very few platforms are built to do natively. Let’s break down where you can get this data, where the gaps are, and how Incendium fills them.

GA4: Can You Measure LTV:CAC?

Not easily. GA4 doesn’t show customer acquisition cost at all, and its Lifetime Value report is:

● Hidden under the “Explore” tab.

● Limited to revenue per user over a fixed period (e.g. 90 days).

● Lacking cohort-level breakdowns.

● Not connected to ad spend or margin data.

So while you can approximate parts of LTV in GA4, you’ll need spreadsheets to:

● Pull in ad costs from Google Ads, Meta, etc.

● Match spend to customer cohorts.

● Adjust for churn, returns, or contribution margin.

It’s doable — but; manual, error-prone, and not scalable.

❌ No CAC
❌ No contribution margin
❌ No retention-based LTV
❌ No channel or campaign granularity

Spreadsheet-Based Models

Many marketers and finance teams rely on custom spreadsheet models. These usually involve:

● Exporting revenue data from Shopify or GA4.

● Pulling in ad costs from platforms like Meta or Google.

● Matching acquisition dates to cohorts.

● Calculating LTV over time.

● Segmenting CAC by channel (if possible).

This can work for small teams — but:

● It's time-consuming.

● Easy to break as your business grows.

● Difficult to segment and troubleshoot.

● Hard to update frequently enough to make real-time decisions.

✅ Flexible
❌ Time-consuming
❌ Not real-time
❌ High error risk

Incendium: LTV:CAC Done Right

Incendium was built for this. It automatically connects:

● Ad platform spend (Google, Meta, TikTok, etc).

● Revenue and margins (from Shopify, Stripe, etc).

● Customer retention curves.

● Channel and campaign attribution.

● Cohort-based performance over time.

Then it presents your true LTV:CAC ratios — by channel, campaign, customer segment, and acquisition cohort — without the need for spreadsheets.

Whether you want to:

● See if paid search is actually profitable.

● Compare returning vs new customers.

● Measure payback periods.

● Or optimize toward high-LTV audiences.

…you’ll have it, instantly.

✅ Automated
✅ Channel + cohort breakdowns
✅ Margin-based LTV
✅ Attribution-integrated
✅ Real-time, self-updating