CCR

(Checkout Completion Rate)

Checkout Completion Rate (CCR) measures the percentage of customers who start the checkout process and successfully complete their purchase. Improving CCR directly impacts revenue by reducing cart abandonment at the critical final step.

Table of Contents
Understanding CCRHow to Calculate CCRWhat’s Considered a Healthy CCR?CCR FAQ
Learning more?
Apply what you know in a platform that measures up!
Try Incendium

Understanding CCR

Checkout Completion Rate is essential for understanding the efficiency of your checkout process. A high CCR indicates a smooth and straightforward checkout experience, while a low rate highlights issues that are putting customers off at the final step.

CCR focuses solely on the checkout process itself, not the entire customer journey from browsing to purchase. This distinguishes it from overall conversion rate metrics, which measure the full funnel from site visit to purchase. CCR isolates the specific moment when customers have already decided to buy and evaluates how effectively your checkout process converts that intent into completed transactions.

How to Calculate CCR

CCR = (Number of Completed Transactions / Number of Initiated Checkouts) × 100

Give it a go in our CCR calculator!

CCR Calculator

Checkout Completion Rate:
Thank you! Your submission has been received!
Oops! Something went wrong while submitting the form.

Calculation Example

Suppose your checkout process needs to maintain at least an 85% completion rate to meet your revenue targets. You're seeing 2,000 customers initiate checkout this week. Calculate the minimum number of completed transactions you need:

Minimum Completed Transactions = Target CCR × Checkouts Initiated

Minimum Completed Transactions = 0.85 × 2,000

Minimum Completed Transactions = 1,700 transactions

Aim to convert at least 1,700 of your 2,000 checkout initiations into completed purchases to maintain your target 85% CCR and meet revenue expectations.

What Tools Measure LTV:CAC Ratio?

You’d think calculating your LTV:CAC ratio would be straightforward — but surprisingly, most tools don’t make it easy.

This metric requires connecting costs with customer value over time — something very few platforms are built to do natively. Let’s break down where you can get this data, where the gaps are, and how Incendium fills them.

GA4: Can You Measure LTV:CAC?

Not easily. GA4 doesn’t show customer acquisition cost at all, and its Lifetime Value report is:

● Hidden under the “Explore” tab.

● Limited to revenue per user over a fixed period (e.g. 90 days).

● Lacking cohort-level breakdowns.

● Not connected to ad spend or margin data.

So while you can approximate parts of LTV in GA4, you’ll need spreadsheets to:

● Pull in ad costs from Google Ads, Meta, etc.

● Match spend to customer cohorts.

● Adjust for churn, returns, or contribution margin.

It’s doable — but; manual, error-prone, and not scalable.

❌ No CAC
❌ No contribution margin
❌ No retention-based LTV
❌ No channel or campaign granularity

Spreadsheet-Based Models

Many marketers and finance teams rely on custom spreadsheet models. These usually involve:

● Exporting revenue data from Shopify or GA4.

● Pulling in ad costs from platforms like Meta or Google.

● Matching acquisition dates to cohorts.

● Calculating LTV over time.

● Segmenting CAC by channel (if possible).

This can work for small teams — but:

● It's time-consuming.

● Easy to break as your business grows.

● Difficult to segment and troubleshoot.

● Hard to update frequently enough to make real-time decisions.

✅ Flexible
❌ Time-consuming
❌ Not real-time
❌ High error risk

Incendium: LTV:CAC Done Right

Incendium was built for this. It automatically connects:

● Ad platform spend (Google, Meta, TikTok, etc).

● Revenue and margins (from Shopify, Stripe, etc).

● Customer retention curves.

● Channel and campaign attribution.

● Cohort-based performance over time.

Then it presents your true LTV:CAC ratios — by channel, campaign, customer segment, and acquisition cohort — without the need for spreadsheets.

Whether you want to:

● See if paid search is actually profitable.

● Compare returning vs new customers.

● Measure payback periods.

● Or optimize toward high-LTV audiences.

…you’ll have it, instantly.

✅ Automated
✅ Channel + cohort breakdowns
✅ Margin-based LTV
✅ Attribution-integrated
✅ Real-time, self-updating

What’s Considered a Healthy CCR?

A "healthy" Checkout Completion Rate varies by industry, device type, and customer segment, but most successful ecommerce sites target 75-85% or higher:
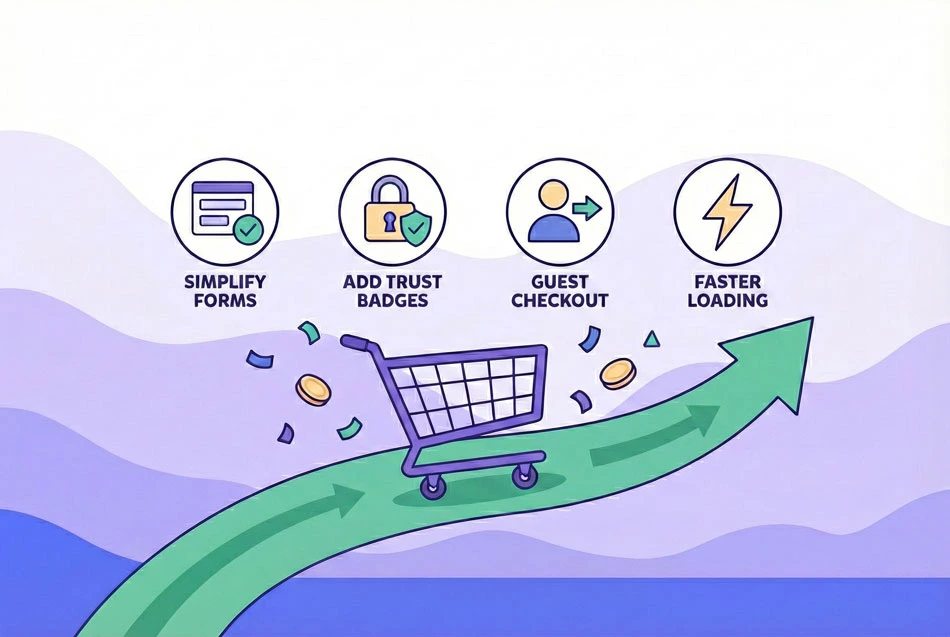
Device type creates significant variation. Desktop checkout completion rates typically range from 75-85%, while mobile rates are often 10-20 percentage points lower (60-70%) due to form complexity, input friction, and distraction factors. If your mobile CCR is dramatically lower than desktop, the issue is likely user experience rather than customer intent.

Industry and product type influence benchmarks. High-consideration purchases (furniture, electronics, luxury items) often show lower CCR (60-75%) as customers comparison shop even after starting checkout. Low-consideration, impulse purchases (fashion, consumables, digital products) typically achieve higher CCR (75-90%) as customers commit more readily once they've decided to buy.

New vs. returning customers show different patterns. First-time buyers often have 10-15 percentage points lower CCR than returning customers due to unfamiliarity with your process, account creation friction, and trust hesitation. Returning customers with saved payment information frequently exceed 85-90% completion rates.

Traffic source affects checkout intent quality. Email and branded search traffic typically shows the highest CCR (80-90%) as these customers have strong purchase intent. Social media and display ad traffic often shows lower rates (60-75%) as the customer journey is less mature and intent less concrete.

Geographic and payment method availability impact rates. Regions where your preferred payment methods are uncommon or shipping is expensive typically show 15-25 percentage points lower CCR. Offering local payment methods and transparent shipping costs dramatically improves regional completion rates.

Tip: The most important benchmark is your own historical baseline segmented by device, customer type, and traffic source. A 5-10 percentage point improvement in CCR can represent hundreds of thousands in recovered revenue—even small optimizations at this stage deliver outsized impact since customers have already demonstrated purchase intent.

CCR FAQ

What Tools Measure LTV:CAC Ratio?

You’d think calculating your LTV:CAC ratio would be straightforward — but surprisingly, most tools don’t make it easy.

This metric requires connecting costs with customer value over time — something very few platforms are built to do natively. Let’s break down where you can get this data, where the gaps are, and how Incendium fills them.

GA4: Can You Measure LTV:CAC?

Not easily. GA4 doesn’t show customer acquisition cost at all, and its Lifetime Value report is:

● Hidden under the “Explore” tab.

● Limited to revenue per user over a fixed period (e.g. 90 days).

● Lacking cohort-level breakdowns.

● Not connected to ad spend or margin data.

So while you can approximate parts of LTV in GA4, you’ll need spreadsheets to:

● Pull in ad costs from Google Ads, Meta, etc.

● Match spend to customer cohorts.

● Adjust for churn, returns, or contribution margin.

It’s doable — but; manual, error-prone, and not scalable.

❌ No CAC
❌ No contribution margin
❌ No retention-based LTV
❌ No channel or campaign granularity

Spreadsheet-Based Models

Many marketers and finance teams rely on custom spreadsheet models. These usually involve:

● Exporting revenue data from Shopify or GA4.

● Pulling in ad costs from platforms like Meta or Google.

● Matching acquisition dates to cohorts.

● Calculating LTV over time.

● Segmenting CAC by channel (if possible).

This can work for small teams — but:

● It's time-consuming.

● Easy to break as your business grows.

● Difficult to segment and troubleshoot.

● Hard to update frequently enough to make real-time decisions.

✅ Flexible
❌ Time-consuming
❌ Not real-time
❌ High error risk

Incendium: LTV:CAC Done Right

Incendium was built for this. It automatically connects:

● Ad platform spend (Google, Meta, TikTok, etc).

● Revenue and margins (from Shopify, Stripe, etc).

● Customer retention curves.

● Channel and campaign attribution.

● Cohort-based performance over time.

Then it presents your true LTV:CAC ratios — by channel, campaign, customer segment, and acquisition cohort — without the need for spreadsheets.

Whether you want to:

● See if paid search is actually profitable.

● Compare returning vs new customers.

● Measure payback periods.

● Or optimize toward high-LTV audiences.

…you’ll have it, instantly.

✅ Automated
✅ Channel + cohort breakdowns
✅ Margin-based LTV
✅ Attribution-integrated
✅ Real-time, self-updating