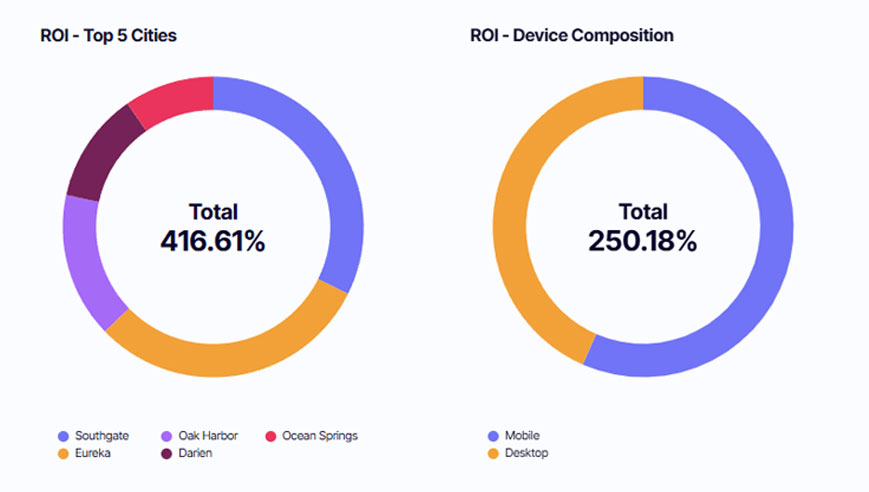
ROI

(Return on Investment)

Return on Investment (ROI) measures the profitability of an investment relative to its cost, providing a clear picture of marketing effectiveness in real terms. Unlike revenue-focused metrics, ROI considers net profit by factoring in all costs associated with generating revenue.

Table of Contents
Understanding ROIHow to Calculate ROIWhat’s Considered a Healthy ROI?ROI FAQ
Learning more?
Apply what you know in a platform that measures up!
Try Incendium

Understanding ROI

ROI is a fundamental metric for any business, yet in marketing it's often misunderstood or confused with similar metrics like ROAS. In ecommerce marketing, ROI goes beyond simple revenue figures to consider net profit, factoring in all costs associated with generating revenue.

This makes ROI a valuable strategic metric that bridges communication between different business departments. For instance, if profit margins change due to a new supplier, fluctuations in ROI can signal to marketing to adjust strategies without manually reviewing all margin data.

The key distinction between ROI and ROAS lies in what costs are considered: ROAS measures revenue generated for every dollar spent on advertising, focusing solely on ad costs and revenue from ads. ROI considers all costs associated with generating revenue, including marketing spend, production costs, shipping, employee salaries, and overhead expenses. ROAS helps judge ad effectiveness and is useful for assessing ad managers or agencies, while ROI provides comprehensive insights into how campaigns or products perform in reality, guiding resource allocation.

How to Calculate ROI

ROI = (Net Profit / Cost of Investment) × 100

Give it a go in our ROI calculator!

ROI Calculator

Return on Investment:
Thank you! Your submission has been received!
Oops! Something went wrong while submitting the form.

Calculation Example

Suppose your business requires at least 150% ROI on marketing campaigns to maintain profitability targets. You're planning a quarterly campaign with a $15,000 budget including ad spend, creative production, and management costs. Calculate the minimum net profit you need to generate:

Minimum Net Profit = Target ROI × Investment Cost

Minimum Net Profit = 1.50 × $15,000

Minimum Net Profit = $22,500

Aim to generate at least $22,500 in net profit from your $15,000 campaign investment to achieve your target 150% ROI and meet profitability expectations.

Note: Net profit means revenue minus all costs (product costs, shipping, fulfillment, AND marketing spend). If the campaign generates $50,000 in revenue with $15,000 in marketing costs and $12,500 in product/fulfillment costs, your net profit is $22,500 ($50,000 - $15,000 - $12,500), achieving exactly 150% ROI.

What Tools Measure LTV:CAC Ratio?

You’d think calculating your LTV:CAC ratio would be straightforward — but surprisingly, most tools don’t make it easy.

This metric requires connecting costs with customer value over time — something very few platforms are built to do natively. Let’s break down where you can get this data, where the gaps are, and how Incendium fills them.

GA4: Can You Measure LTV:CAC?

Not easily. GA4 doesn’t show customer acquisition cost at all, and its Lifetime Value report is:

● Hidden under the “Explore” tab.

● Limited to revenue per user over a fixed period (e.g. 90 days).

● Lacking cohort-level breakdowns.

● Not connected to ad spend or margin data.

So while you can approximate parts of LTV in GA4, you’ll need spreadsheets to:

● Pull in ad costs from Google Ads, Meta, etc.

● Match spend to customer cohorts.

● Adjust for churn, returns, or contribution margin.

It’s doable — but; manual, error-prone, and not scalable.

❌ No CAC
❌ No contribution margin
❌ No retention-based LTV
❌ No channel or campaign granularity

Spreadsheet-Based Models

Many marketers and finance teams rely on custom spreadsheet models. These usually involve:

● Exporting revenue data from Shopify or GA4.

● Pulling in ad costs from platforms like Meta or Google.

● Matching acquisition dates to cohorts.

● Calculating LTV over time.

● Segmenting CAC by channel (if possible).

This can work for small teams — but:

● It's time-consuming.

● Easy to break as your business grows.

● Difficult to segment and troubleshoot.

● Hard to update frequently enough to make real-time decisions.

✅ Flexible
❌ Time-consuming
❌ Not real-time
❌ High error risk

Incendium: LTV:CAC Done Right

Incendium was built for this. It automatically connects:

● Ad platform spend (Google, Meta, TikTok, etc).

● Revenue and margins (from Shopify, Stripe, etc).

● Customer retention curves.

● Channel and campaign attribution.

● Cohort-based performance over time.

Then it presents your true LTV:CAC ratios — by channel, campaign, customer segment, and acquisition cohort — without the need for spreadsheets.

Whether you want to:

● See if paid search is actually profitable.

● Compare returning vs new customers.

● Measure payback periods.

● Or optimize toward high-LTV audiences.

…you’ll have it, instantly.

✅ Automated
✅ Channel + cohort breakdowns
✅ Margin-based LTV
✅ Attribution-integrated
✅ Real-time, self-updating

What’s Considered a Healthy ROI?

A "healthy" ROI depends on your business model, profit margins, industry, and growth stage, but understanding the fundamental economics is critical:

Breakeven ROI is 0%—anything above is profitable. However, most businesses target significantly higher ROI to account for opportunity cost, risk, and growth needs. Target ROI typically ranges from 100-400% depending on industry and business maturity.

Profit margins determine viable ROI ranges. High-margin businesses (software, digital products, luxury goods) with 60-80% margins can achieve ROI of 300-500%+ because most revenue flows to profit. Low-margin businesses (consumables, commodity products) with 20-30% margins typically see ROI of 50-150% because costs consume most revenue.

Growth stage influences acceptable ROI levels. Early-stage businesses building market share may accept ROI of 50-100% while investing in customer acquisition and brand awareness. Mature businesses optimizing for profitability typically target ROI of 200-400%+ to justify marketing investment over alternative uses of capital.

Channel and campaign type create wide variation. Brand-building campaigns often show 25-75% ROI short-term but create lasting value through improved organic performance and reduced future acquisition costs. Performance marketing campaigns targeting existing demand typically achieve 150-300% ROI immediately.

Time horizon dramatically affects ROI calculation. SEO, content marketing, and email list building may show 0-50% ROI in month one but 300-500%+ ROI by month twelve as the investment compounds. Short-term ROI measurement undervalues long-term strategies while overvaluing quick-win tactics.

Tip: The most important benchmark is whether your ROI exceeds your weighted average cost of capital (WACC) and alternative investment returns. If you can generate 200% ROI on marketing but your business could generate 300% ROI expanding product lines, marketing investment destroys value. Always evaluate ROI in context of all growth opportunities.

ROI FAQ

What Tools Measure LTV:CAC Ratio?

You’d think calculating your LTV:CAC ratio would be straightforward — but surprisingly, most tools don’t make it easy.

This metric requires connecting costs with customer value over time — something very few platforms are built to do natively. Let’s break down where you can get this data, where the gaps are, and how Incendium fills them.

GA4: Can You Measure LTV:CAC?

Not easily. GA4 doesn’t show customer acquisition cost at all, and its Lifetime Value report is:

● Hidden under the “Explore” tab.

● Limited to revenue per user over a fixed period (e.g. 90 days).

● Lacking cohort-level breakdowns.

● Not connected to ad spend or margin data.

So while you can approximate parts of LTV in GA4, you’ll need spreadsheets to:

● Pull in ad costs from Google Ads, Meta, etc.

● Match spend to customer cohorts.

● Adjust for churn, returns, or contribution margin.

It’s doable — but; manual, error-prone, and not scalable.

❌ No CAC
❌ No contribution margin
❌ No retention-based LTV
❌ No channel or campaign granularity

Spreadsheet-Based Models

Many marketers and finance teams rely on custom spreadsheet models. These usually involve:

● Exporting revenue data from Shopify or GA4.

● Pulling in ad costs from platforms like Meta or Google.

● Matching acquisition dates to cohorts.

● Calculating LTV over time.

● Segmenting CAC by channel (if possible).

This can work for small teams — but:

● It's time-consuming.

● Easy to break as your business grows.

● Difficult to segment and troubleshoot.

● Hard to update frequently enough to make real-time decisions.

✅ Flexible
❌ Time-consuming
❌ Not real-time
❌ High error risk

Incendium: LTV:CAC Done Right

Incendium was built for this. It automatically connects:

● Ad platform spend (Google, Meta, TikTok, etc).

● Revenue and margins (from Shopify, Stripe, etc).

● Customer retention curves.

● Channel and campaign attribution.

● Cohort-based performance over time.

Then it presents your true LTV:CAC ratios — by channel, campaign, customer segment, and acquisition cohort — without the need for spreadsheets.

Whether you want to:

● See if paid search is actually profitable.

● Compare returning vs new customers.

● Measure payback periods.

● Or optimize toward high-LTV audiences.

…you’ll have it, instantly.

✅ Automated
✅ Channel + cohort breakdowns
✅ Margin-based LTV
✅ Attribution-integrated
✅ Real-time, self-updating